


Kerala Plus Two 2025 Economics (SY-635) Model Question Paper with solutions PDFs are now available for download. The Kerala Plus Two Physics Model Examination 2025 was conducted by the Directorate of Higher Secondary Education (DHSE), Kerala, to help students prepare for the final board exams. The paper is designed as per the latest syllabus and exam pattern prescribed for the academic year 2025–26.
Kerala Plus Two 2025 Economics (SY-635) Model Question Paper with solutions
| Kerala Plus Two 2025 Economics (SY-635) Model Question Paper | Check Solutions |

Gross fiscal deficit \(-\) Net interest liabilities \(=\) \underline{\hspace{3cm
View Solution
Step 1: Understand the concept of Gross Fiscal Deficit.
Gross Fiscal Deficit (GFD) represents the total borrowing requirements of the governmentIt includes interest payments on previous borrowings along with current expenditures over revenues
Step 2: Understand Net Interest Liabilities.
Net interest liabilities refer to the interest payments that the government has to make on its past debtThese are obligatory payments and do not reflect current fiscal performance
Step 3: Define Primary Deficit.
Primary Deficit is defined as the fiscal deficit excluding interest paymentsIt shows the current year’s fiscal position without the burden of past debt
Step 4: Apply the formula.
\[ Primary Deficit = Gross Fiscal Deficit - Net Interest Liabilities \]
Hence, Gross fiscal deficit minus net interest liabilities gives the Primary Deficit
Final Answer:
Primary Deficit Quick Tip: Primary deficit helps in assessing whether the government is borrowing to meet current expenses or only to repay past debt.
The shape of AFC curve
View Solution
Step 1: Understand Average Fixed Cost (AFC).
Average Fixed Cost is obtained by dividing Total Fixed Cost by Quantity of OutputAs output increases, fixed cost is spread over more units
Step 2: Behaviour of Fixed Cost.
Total Fixed Cost remains constant irrespective of the level of outputHence, AFC continuously falls as output increases
Step 3: Shape of the AFC curve.
Since AFC decreases at a diminishing rate and never touches the axes, its graphical representation takes the shape of a rectangular hyperbola
Final Answer:
Rectangular hyperbola Quick Tip: Average Fixed Cost always falls with an increase in output and its curve never becomes zero, giving it a rectangular hyperbola shape.
Goods that are used by producers as inputs
View Solution
Step 1: Understand the meaning of production inputs.
Producers require certain goods and services to carry out the process of productionThese goods are not meant for final consumption but are used to produce other goods
Step 2: Define Intermediate Goods.
Intermediate goods are those goods which are used as inputs in the production of other goodsThey are either completely used up or transformed during the production process
Step 3: Eliminate incorrect options.
Final goods and consumer goods are meant for direct consumption by consumers and are not used as production inputsHence, they cannot be the correct answer
Step 4: Conclusion.
Goods that are used by producers as inputs are called Intermediate goods
Final Answer:
Intermediate goods Quick Tip: Intermediate goods are excluded from GDP calculations to avoid the problem of double counting.
When income increases, the budget line shifts towards
View Solution
Step 1: Understand the concept of a budget line.
A budget line represents all possible combinations of two goods that a consumer can purchase with a given income at given prices
Step 2: Effect of change in income.
When the income of the consumer increases and prices of goods remain constant, the purchasing power of the consumer increases
Step 3: Direction of shift of budget line.
An increase in income causes the budget line to shift parallelly outward, away from the origin, which is towards the right
Step 4: Conclusion.
Therefore, when income increases, the budget line shifts towards the right
Final Answer:
Right Quick Tip: A change in income causes a parallel shift of the budget line, while a change in price causes a rotation of the budget line.
The point on which a firm earns only normal profit in the short run
View Solution
Step 1: Understand normal profit.
Normal profit refers to the minimum level of profit required by a firm to keep operating in the industryAt this level, total revenue is equal to total cost
Step 2: Define the break even point.
The break even point is the level of output at which total revenue equals total costAs a result, the firm earns neither supernormal profit nor incurs losses
Step 3: Eliminate incorrect options.
Shutdown point refers to the situation where price equals average variable costExcess demand and excess supply are market situations and not related to profit levels
Step 4: Conclusion.
Thus, the firm earns only normal profit at the break even point
Final Answer:
Break even point Quick Tip: At the break even point, Total Revenue = Total Cost, implying zero economic profit.
Want satisfying capacity of a commodity
View Solution
Step 1: Understand the meaning of want satisfaction.
In economics, every commodity is consumed because it satisfies some human wantThe degree to which a good satisfies a want is an important concept
Step 2: Define Utility.
Utility refers to the want satisfying power or capacity of a commodityIt explains why consumers demand a particular good
Step 3: Eliminate incorrect options.
Demand refers to the quantity consumers are willing to buySupply refers to the quantity producers are willing to sellProduction refers to the creation of goodsNone of these define want satisfying capacity
Step 4: Conclusion.
Therefore, the want satisfying capacity of a commodity is called Utility
Final Answer:
Utility Quick Tip: Utility is subjective and varies from person to person depending on preferences and circumstances.
Currency held by public \(+\) deposit \(=\)
View Solution
Step 1: Understand the components of money supply.
Money supply is classified into different measures such as \(M_1\), \(M_2\), \(M_3\), and \(M_4\) based on liquidity and use
Step 2: Define \(M_1\).
\(M_1\) is known as narrow moneyIt includes currency held by the public and demand deposits with banks
Step 3: Match the given expression.
The given expression currency held by public plus deposit exactly represents the definition of \(M_1\)
Step 4: Conclusion.
Therefore, currency held by public plus deposits is equal to \(M_1\)
Final Answer: \(M_1\) Quick Tip: \(M_1\) is the most liquid measure of money supply as it can be directly used for transactions.
The year in which J.M. Keynes published his book `The General Theory of Employment, Interest and Money`
View Solution
Step 1: Identify the book and author.
`The General Theory of Employment, Interest and Money` is a famous book written by British economist John Maynard KeynesIt laid the foundation of modern macroeconomics
Step 2: Historical background.
The book was written in response to the Great Depression of the 1930s and challenged the classical economic theories prevailing at that time
Step 3: Year of publication.
John Maynard Keynes published this book in the year 1936
Step 4: Conclusion.
Therefore, the correct answer is 1936
Final Answer:
1936 Quick Tip: Keynes’s General Theory marked a major shift from classical economics to Keynesian economics.
The consumption that takes place when income is zero. It is called
View Solution
Step 1: Understand consumption at zero income.
Even when income is zero, people still need to consume basic necessitiesThis consumption is financed through past savings or borrowings
Step 2: Define Autonomous Consumption.
Autonomous consumption refers to the level of consumption that is independent of incomeIt occurs even when income is zero
Step 3: Eliminate incorrect options.
Induced consumption varies with incomeAutonomous investment is related to investment, not consumptionHence, these options are incorrect
Step 4: Conclusion.
Therefore, the consumption that takes place when income is zero is called autonomous consumption
Final Answer:
Autonomous consumption Quick Tip: Autonomous consumption is represented by the intercept of the consumption function on the consumption axis.
Which among the following is a flow variable ?
View Solution
Step 1: Understand flow and stock variables.
A flow variable is measured over a period of time, whereas a stock variable is measured at a particular point of time
Step 2: Analyse each option.
Capital is a stock variable as it exists at a point of timeDemand for money and supply of money are also stock variables measured at a specific time
Step 3: Identify the flow variable.
GDP measures the value of goods and services produced over a period of time, such as a yearHence, it is a flow variable
Step 4: Conclusion.
Therefore, GDP is a flow variable
Final Answer:
GDP Quick Tip: Always remember: variables measured per unit of time are flow variables, while variables measured at a point of time are stock variables.
Give any two examples of negative externalities.
View Solution
In economics, an externality refers to the effect of an economic activity on third parties who are not directly involved in that activity. When the impact of such an activity creates harm or imposes costs on others without compensation, it is known as a negative externality. These costs are called social costs and are not fully reflected in the market price of the goods or services produced. As a result, negative externalities often lead to overproduction and inefficiency in the market.
Example 1: Environmental pollution caused by industries
Industries and factories often emit smoke, toxic gases, and chemical waste into the air, water, and soil during the process of production. While the firms benefit from lower production costs and higher profits, the surrounding community suffers from polluted air and water. This can lead to health problems such as respiratory diseases, skin infections, and waterborne illnesses. Additionally, pollution can damage crops, harm wildlife, and degrade natural resources. The cost of medical treatment and environmental damage is borne by society rather than the producers, making industrial pollution a classic example of a negative externality.
Example 2: Noise pollution due to transportation
The excessive use of automobiles, trains, aircraft, and industrial machinery generates high levels of noise pollution, especially in urban areas. Continuous exposure to loud noise can cause stress, sleep disturbances, hearing loss, and reduced productivity. Residents living near highways, airports, or busy commercial areas often experience these negative effects even though they are not directly responsible for the noise. Since vehicle owners and transport operators do not pay for the inconvenience and health issues caused to others, noise pollution represents another important example of a negative externality.
Thus, negative externalities arise when private economic activities impose social costs on others. Governments often intervene through regulations, taxes, or pollution control measures to reduce such externalities and promote social welfare.
Quick Tip: Negative externalities lead to market failure because the true social cost of production is higher than the private cost borne by producers.
Name the four sectors of the economy according to the macro economic point of view.
View Solution
In macroeconomics, the entire economy is divided into different sectors to study the flow of income, production, and expenditure at an aggregate level. These sectors represent the main participants in economic activities.
Step 1: Household Sector
This sector consists of all individuals or groups of individuals who consume goods and services. Households supply factors of production such as labour, land, and capital to other sectors and earn income in the form of wages, rent, interest, and profit.
Step 2: Production (Firm) Sector
The production sector includes all firms and enterprises that produce goods and services. This sector hires factors of production from households and makes payments in return. It also sells goods and services to households, the government, and the foreign sector.
Step 3: Government Sector
The government sector includes central, state, and local governments. It collects taxes from households and firms, provides public goods and services, and makes transfer payments such as subsidies and welfare benefits.
Step 4: Foreign Sector
The foreign sector consists of all economic transactions between a country and the rest of the world. It includes exports, imports, foreign investment, and international trade activities.
Thus, the four sectors of the economy from a macroeconomic point of view are the household sector, production sector, government sector, and foreign sector.
Quick Tip: In macroeconomics, sectors are identified to understand circular flow of income and overall economic functioning at a national level.
If demand curve shifts rightwards and supply curve remains constant, what will be the effect on equilibrium price and output?
View Solution
Step 1: Understanding the rightward shift of the demand curve.
A rightward shift of the demand curve indicates an increase in demand at every given price. This may occur due to factors such as increase in income, rise in population, change in tastes in favour of the commodity, or increase in prices of substitute goods.
Step 2: Understanding the condition of constant supply.
When the supply curve remains constant, it means that the quantity supplied at each price level does not change. There is no change in factors affecting supply such as technology, cost of production, or number of producers.
Step 3: Effect on equilibrium price.
Due to the increase in demand while supply remains unchanged, excess demand is created at the original equilibrium price. This excess demand puts upward pressure on price, leading to an increase in the equilibrium price.
Step 4: Effect on equilibrium output.
As the price rises, producers are willing to supply more along the same supply curve. Hence, the equilibrium quantity (output) also increases.
Step 5: Final conclusion.
When demand increases and supply remains constant, both equilibrium price and equilibrium output increase.
Quick Tip: Always remember: an increase in demand with no change in supply leads to a rise in both equilibrium price and quantity.
Distinguish between devaluation and revaluation.
View Solution
Step 1: Meaning of Devaluation.
Devaluation refers to a deliberate reduction in the value of a country’s domestic currency in terms of foreign currencies. It is officially done by the government or monetary authority under a fixed exchange rate system. Devaluation makes exports cheaper and imports more expensive, thereby encouraging exports and reducing imports.
Step 2: Meaning of Revaluation.
Revaluation refers to a deliberate increase in the value of a country’s domestic currency in relation to foreign currencies. It is also carried out by the government or monetary authority under a fixed exchange rate system. Revaluation makes imports cheaper and exports more expensive.
Step 3: Basis of Difference.
Devaluation is generally adopted to correct an adverse balance of payments situation, whereas revaluation is adopted when a country experiences a surplus in its balance of payments.
Step 4: Comparative Summary.
Devaluation reduces the external value of currency to boost exports, while revaluation increases the external value of currency to control excessive exports and inflationary pressure.
Quick Tip: Remember: \textbf{Devaluation = Decrease in currency value}, \textbf{Revaluation = Increase in currency value}, and both are applied under a fixed exchange rate system.
Write any two features of market economy.
View Solution
A market economy is an economic system in which economic decisions regarding production, consumption, and distribution of goods and services are guided by market forces such as demand and supply. In this system, individuals and private firms play a central role, and the government has limited intervention. The following are two important features of a market economy explained in detail.
Feature 1: Private ownership of resources
One of the most significant features of a market economy is private ownership of factors of production such as land, labour, capital, and entrepreneurship. Individuals and private enterprises have the legal right to own, use, and transfer property according to their interests. This ownership encourages people to invest, innovate, and efficiently use resources because they are entitled to the profits earned from their economic activities. Private ownership also promotes economic freedom, as individuals can choose their occupations, businesses, and consumption patterns without excessive government control.
Feature 2: Price mechanism
Another key feature of a market economy is the price mechanism, which operates through the interaction of demand and supply in the market. Prices of goods and services are determined by market forces without direct government intervention. When demand for a product increases, prices tend to rise, encouraging producers to increase supply. Conversely, when demand decreases, prices fall, leading to a reduction in production. This automatic adjustment helps in efficient allocation of resources and ensures that goods and services are produced according to consumer preferences. The price mechanism acts as a guide for producers and consumers in making economic decisions.
Thus, a market economy functions on the principles of private ownership and free price determination, which together promote efficiency, competition, and economic growth.
Quick Tip: In a market economy, economic decisions are mainly taken by individuals and firms, while the government plays a limited regulatory role.
Write any three features of indifference curve.
View Solution
An indifference curve represents various combinations of two goods that give the consumer the same level of satisfaction. The important features of an indifference curve are explained below.
Feature 1: Indifference curves slope downward from left to right.
This downward slope indicates that if the quantity of one good increases, the quantity of the other good must decrease to keep the level of satisfaction constant.
Feature 2: Indifference curves are convex to the origin.
The convex shape shows the law of diminishing marginal rate of substitution, which means that a consumer is willing to give up less and less of one good for additional units of the other good.
Feature 3: Indifference curves never intersect each other.
If two indifference curves intersect, it would lead to contradictory levels of satisfaction, which is not possible in consumer theory.
Quick Tip: Indifference curves always represent equal satisfaction levels and help in understanding consumer preferences.
Complete the following :
(a) \[ \frac{\Delta TC}{\Delta q} = \hspace{3cm} \]
(b) \[ \frac{TFC}{q} = \hspace{3cm} \]
(c) \[ AVC + AFC = \hspace{3cm} \]
View Solution
Step 1: Explanation of part (a)
The change in total cost divided by the change in quantity produced gives marginal cost. Therefore:
\[ \frac{\Delta TC}{\Delta q} = MC \]
Step 2: Explanation of part (b)
Total fixed cost divided by quantity produced gives average fixed cost. Hence:
\[ \frac{TFC}{q} = AFC \]
Step 3: Explanation of part (c)
Average total cost is the sum of average variable cost and average fixed cost. Thus:
\[ AVC + AFC = ATC \] Quick Tip: Remember: \textbf{MC = ΔTC/Δq}, \textbf{AFC = TFC/q}, and \textbf{ATC = AVC + AFC}.
Explain the three types of budget.
View Solution
A budget is a statement of expected receipts and expenditures of the government for a given financial year. On the basis of the relationship between receipts and expenditures, budgets are classified into three types:
Step 1: Balanced Budget.
A balanced budget is one in which the estimated government receipts are equal to the estimated government expenditures. In this type of budget, there is neither surplus nor deficit. The government aims to maintain financial stability and avoid inflationary or deflationary pressures.
Step 2: Surplus Budget.
A surplus budget is one in which the estimated government receipts exceed the estimated government expenditures. This type of budget is usually adopted to control inflation and reduce public debt. Excess revenue may be used to repay loans or build reserves.
Step 3: Deficit Budget.
A deficit budget is one in which the estimated government expenditures exceed the estimated government receipts. This type of budget is generally adopted to promote economic growth, increase employment, and finance development projects, especially during periods of economic slowdown.
Step 4: Conclusion.
Thus, balanced, surplus, and deficit budgets reflect different fiscal policies adopted by the government according to economic conditions.
Quick Tip: Deficit budget is commonly used by developing countries to accelerate economic growth.
What are the central problems of an economy in relation to scarce resources?
View Solution
The central problems of an economy arise due to the problem of scarcity of resources in relation to unlimited human wants. Every economy must make choices regarding the use of limited resources. These central problems are as follows:
Step 1: What to produce?
This problem relates to the choice of goods and services to be produced and in what quantities. Since resources are limited, an economy must decide whether to produce consumer goods, capital goods, or a combination of both.
Step 2: How to produce?
This problem concerns the choice of techniques of production. An economy must decide whether to use labour-intensive or capital-intensive methods, depending on the availability and cost of resources.
Step 3: For whom to produce?
This problem relates to the distribution of goods and services among different sections of society. It depends on how national income is distributed among individuals and households.
Step 4: Conclusion.
Thus, due to scarcity of resources, every economy must make choices regarding production, technique, and distribution to ensure efficient use of resources.
Quick Tip: The central problems of an economy exist because human wants are unlimited while resources are limited.
If investment increases by 200 crores and MPC is 0.2, what will be the increase in total income?
View Solution
Step 1: Write the formula of investment multiplier.
The investment multiplier (\( k \)) is given by:
\[ k = \frac{1}{1 - MPC} \]
Step 2: Substitute the given value of MPC.
Given, \( MPC = 0.2 \)
\[ k = \frac{1}{1 - 0.2} = \frac{1}{0.8} = 1.25 \]
Step 3: Calculate the increase in total income.
Increase in income (\( \Delta Y \)) is given by:
\[ \Delta Y = k \times \Delta I \]
where \( \Delta I = 200 \) crores
\[ \Delta Y = 1.25 \times 200 = 250 crores \]
Step 4: Final result.
Thus, the total income will increase by 250 crores.
Quick Tip: Higher the value of MPC, greater will be the value of the investment multiplier and hence larger the increase in national income.
Distinguish between substitute goods and complementary goods. Give example for each.
View Solution
In economics, goods can be classified based on the relationship between their demand. Two important types of related goods are substitute goods and complementary goods. These goods differ in terms of their usage, demand relationship, and price effects. The distinction between them is explained below.
Substitute Goods:
Substitute goods are those goods which can be used in place of one another to satisfy the same want. When the price of one good increases, the demand for its substitute increases, and when the price of one good decreases, the demand for its substitute decreases. This is because consumers shift their consumption from the relatively expensive good to the cheaper alternative. Substitute goods have a positive cross elasticity of demand.
Example: Tea and coffee are substitute goods. If the price of tea increases, consumers may switch to coffee, leading to an increase in the demand for coffee.
Complementary Goods:
Complementary goods are those goods which are used together to satisfy a particular want. The demand for complementary goods moves in the same direction. When the price of one good increases, the demand for both goods decreases, and when the price decreases, the demand for both goods increases. Complementary goods have a negative cross elasticity of demand.
Example: Car and petrol are complementary goods. A car cannot be used without petrol, so an increase in the price of petrol reduces the demand for cars as well.
Conclusion:
Thus, substitute goods replace each other in consumption, whereas complementary goods are jointly demanded. Understanding this distinction helps in analyzing consumer behavior and market demand.
Quick Tip: If two goods can replace each other, they are substitutes; if they are used together, they are complementary goods.
The market price of a good increases from Rs. 10 to Rs. 25. Therefore the quantity supplied by the firm increases from 15 to 20 units. Calculate the price elasticity of supply.
View Solution
Price elasticity of supply measures the degree of responsiveness of quantity supplied of a good to a change in its price. It shows how much the quantity supplied changes when the price changes. The formula for price elasticity of supply is given by:
\[ E_s = \frac{Percentage change in quantity supplied}{Percentage change in price} \]
Alternatively, the elasticity of supply can be calculated using the following formula:
\[ E_s = \frac{\Delta Q}{\Delta P} \times \frac{P}{Q} \]
where:
\( \Delta Q \) = Change in quantity supplied
\( \Delta P \) = Change in price
\( P \) = Original price
\( Q \) = Original quantity supplied
Step 1: Calculate the change in price and quantity supplied.
Original price \( P_1 = 10 \)
New price \( P_2 = 25 \)
\[ \Delta P = 25 - 10 = 15 \]
Original quantity \( Q_1 = 15 \) units
New quantity \( Q_2 = 20 \) units
\[ \Delta Q = 20 - 15 = 5 \]
Step 2: Substitute the values into the elasticity formula.
\[ E_s = \frac{5}{15} \times \frac{10}{15} \]
Step 3: Simplify the expression.
\[ E_s = \frac{1}{3} \times \frac{2}{3} = \frac{2}{9} \]
\[ E_s \approx 0.22 \]
Conclusion:
The price elasticity of supply is less than 1, which indicates that supply is relatively inelastic. This means that the quantity supplied responds less proportionately to the change in price.
Quick Tip: If the value of price elasticity of supply is less than 1, the supply is inelastic; if it is greater than 1, the supply is elastic.
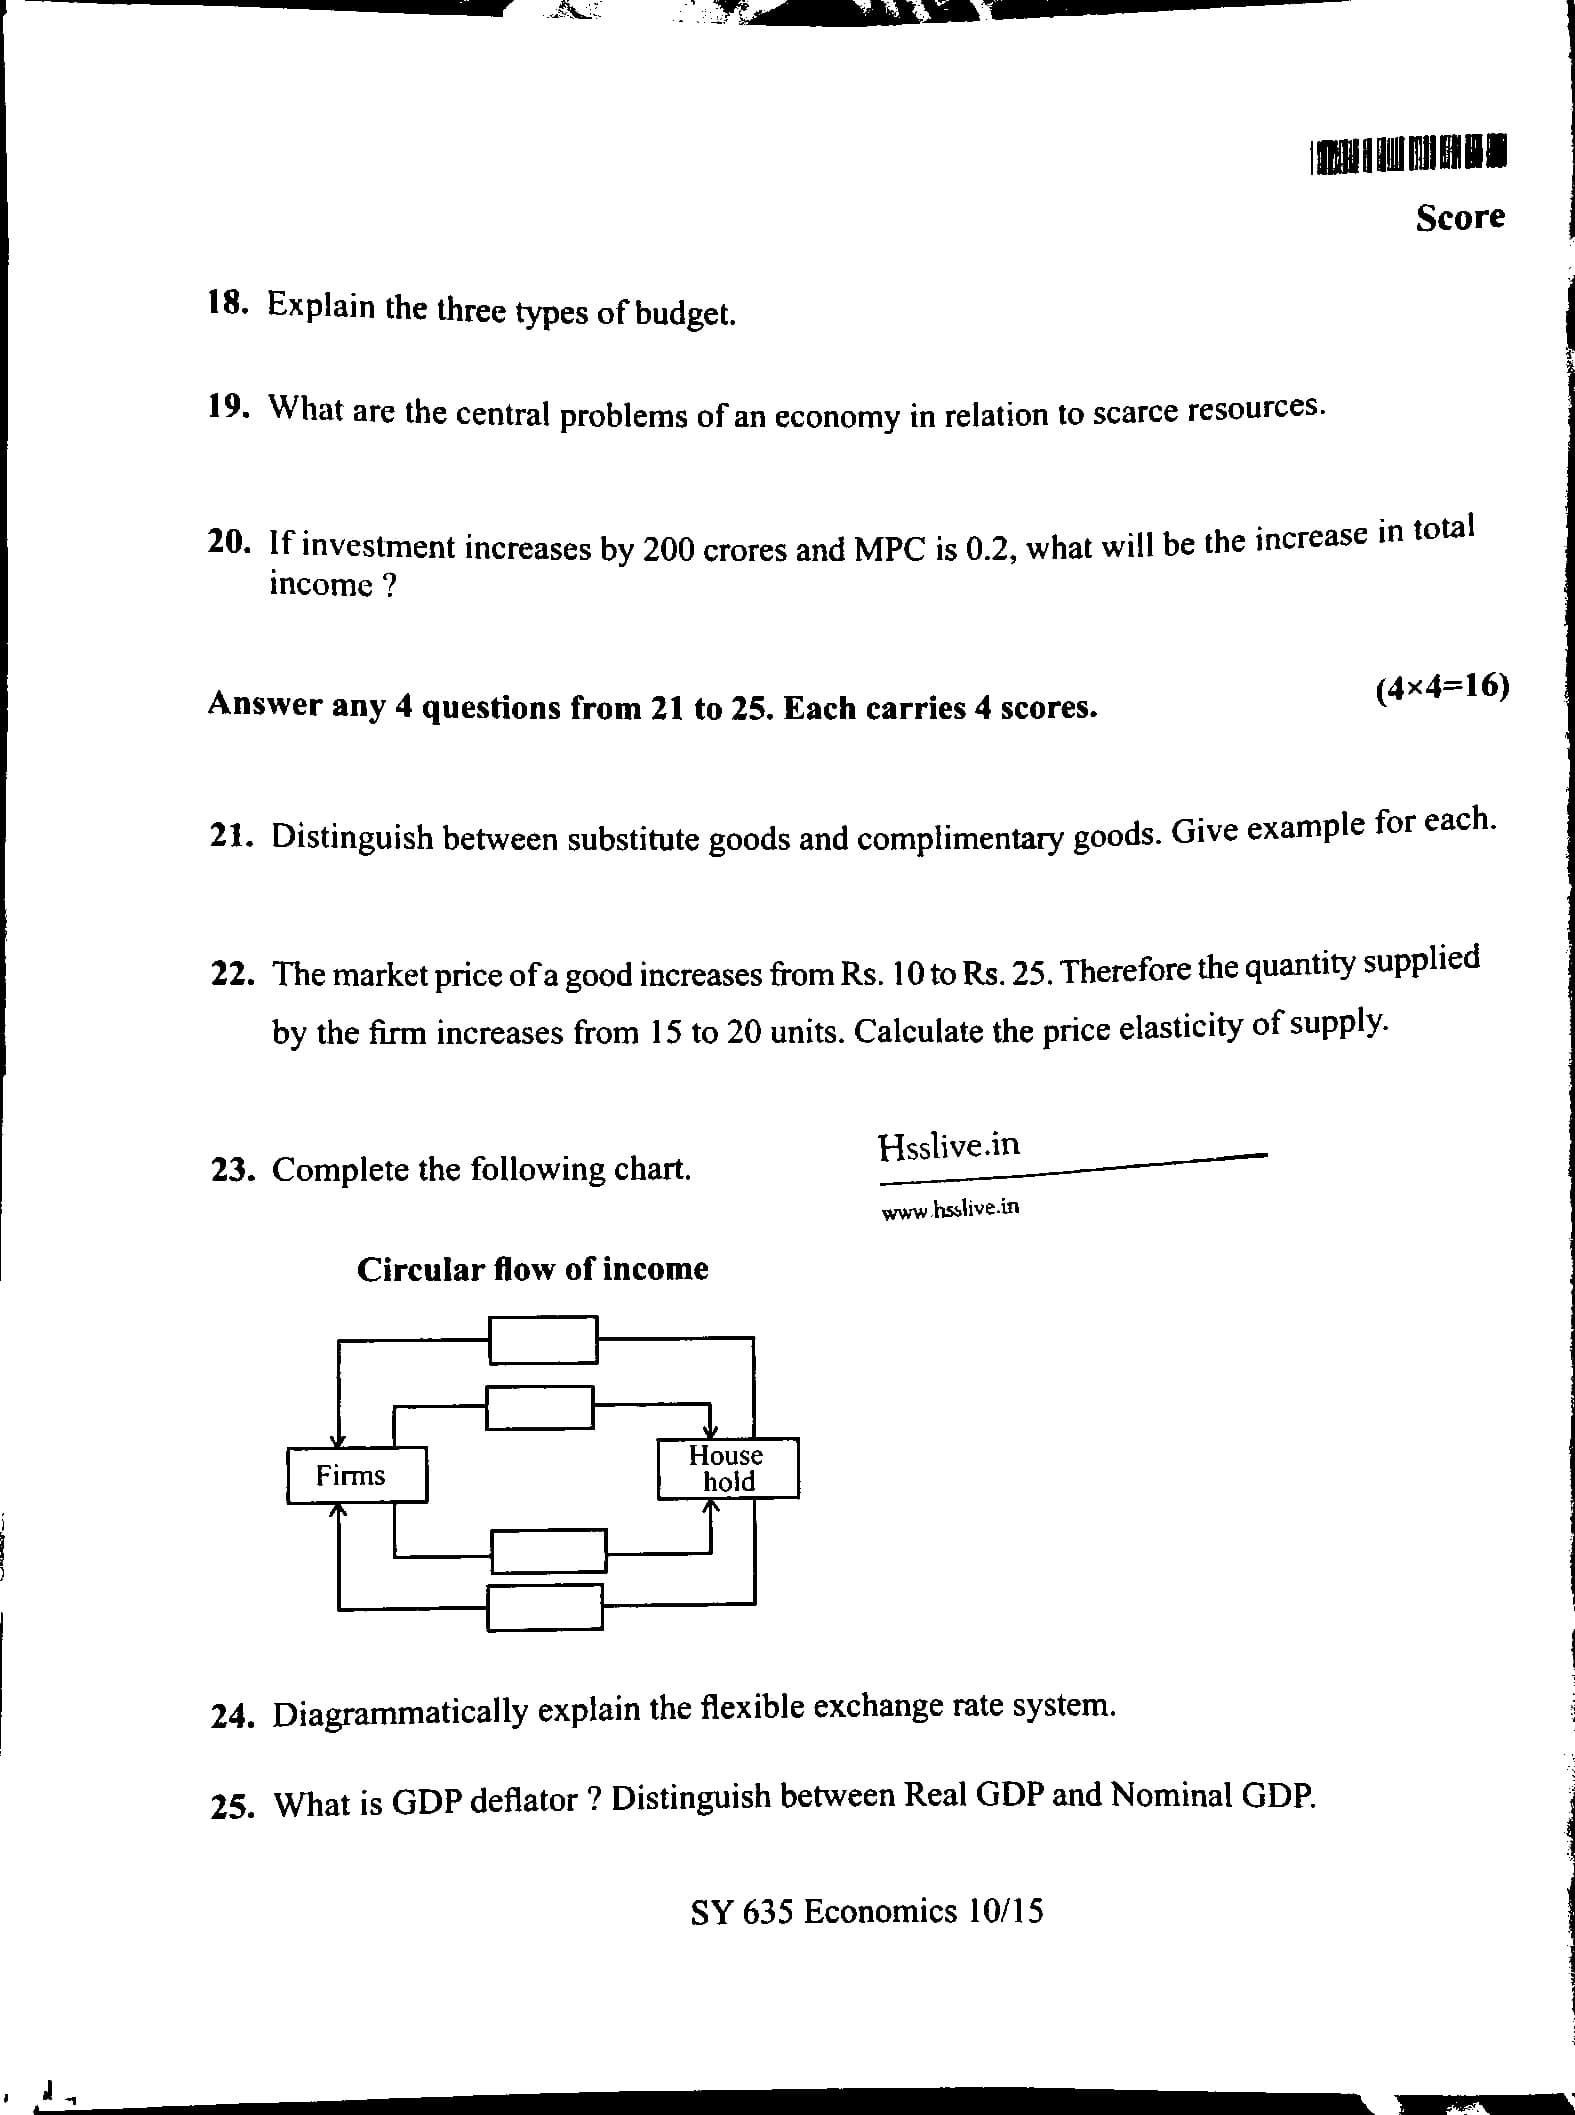
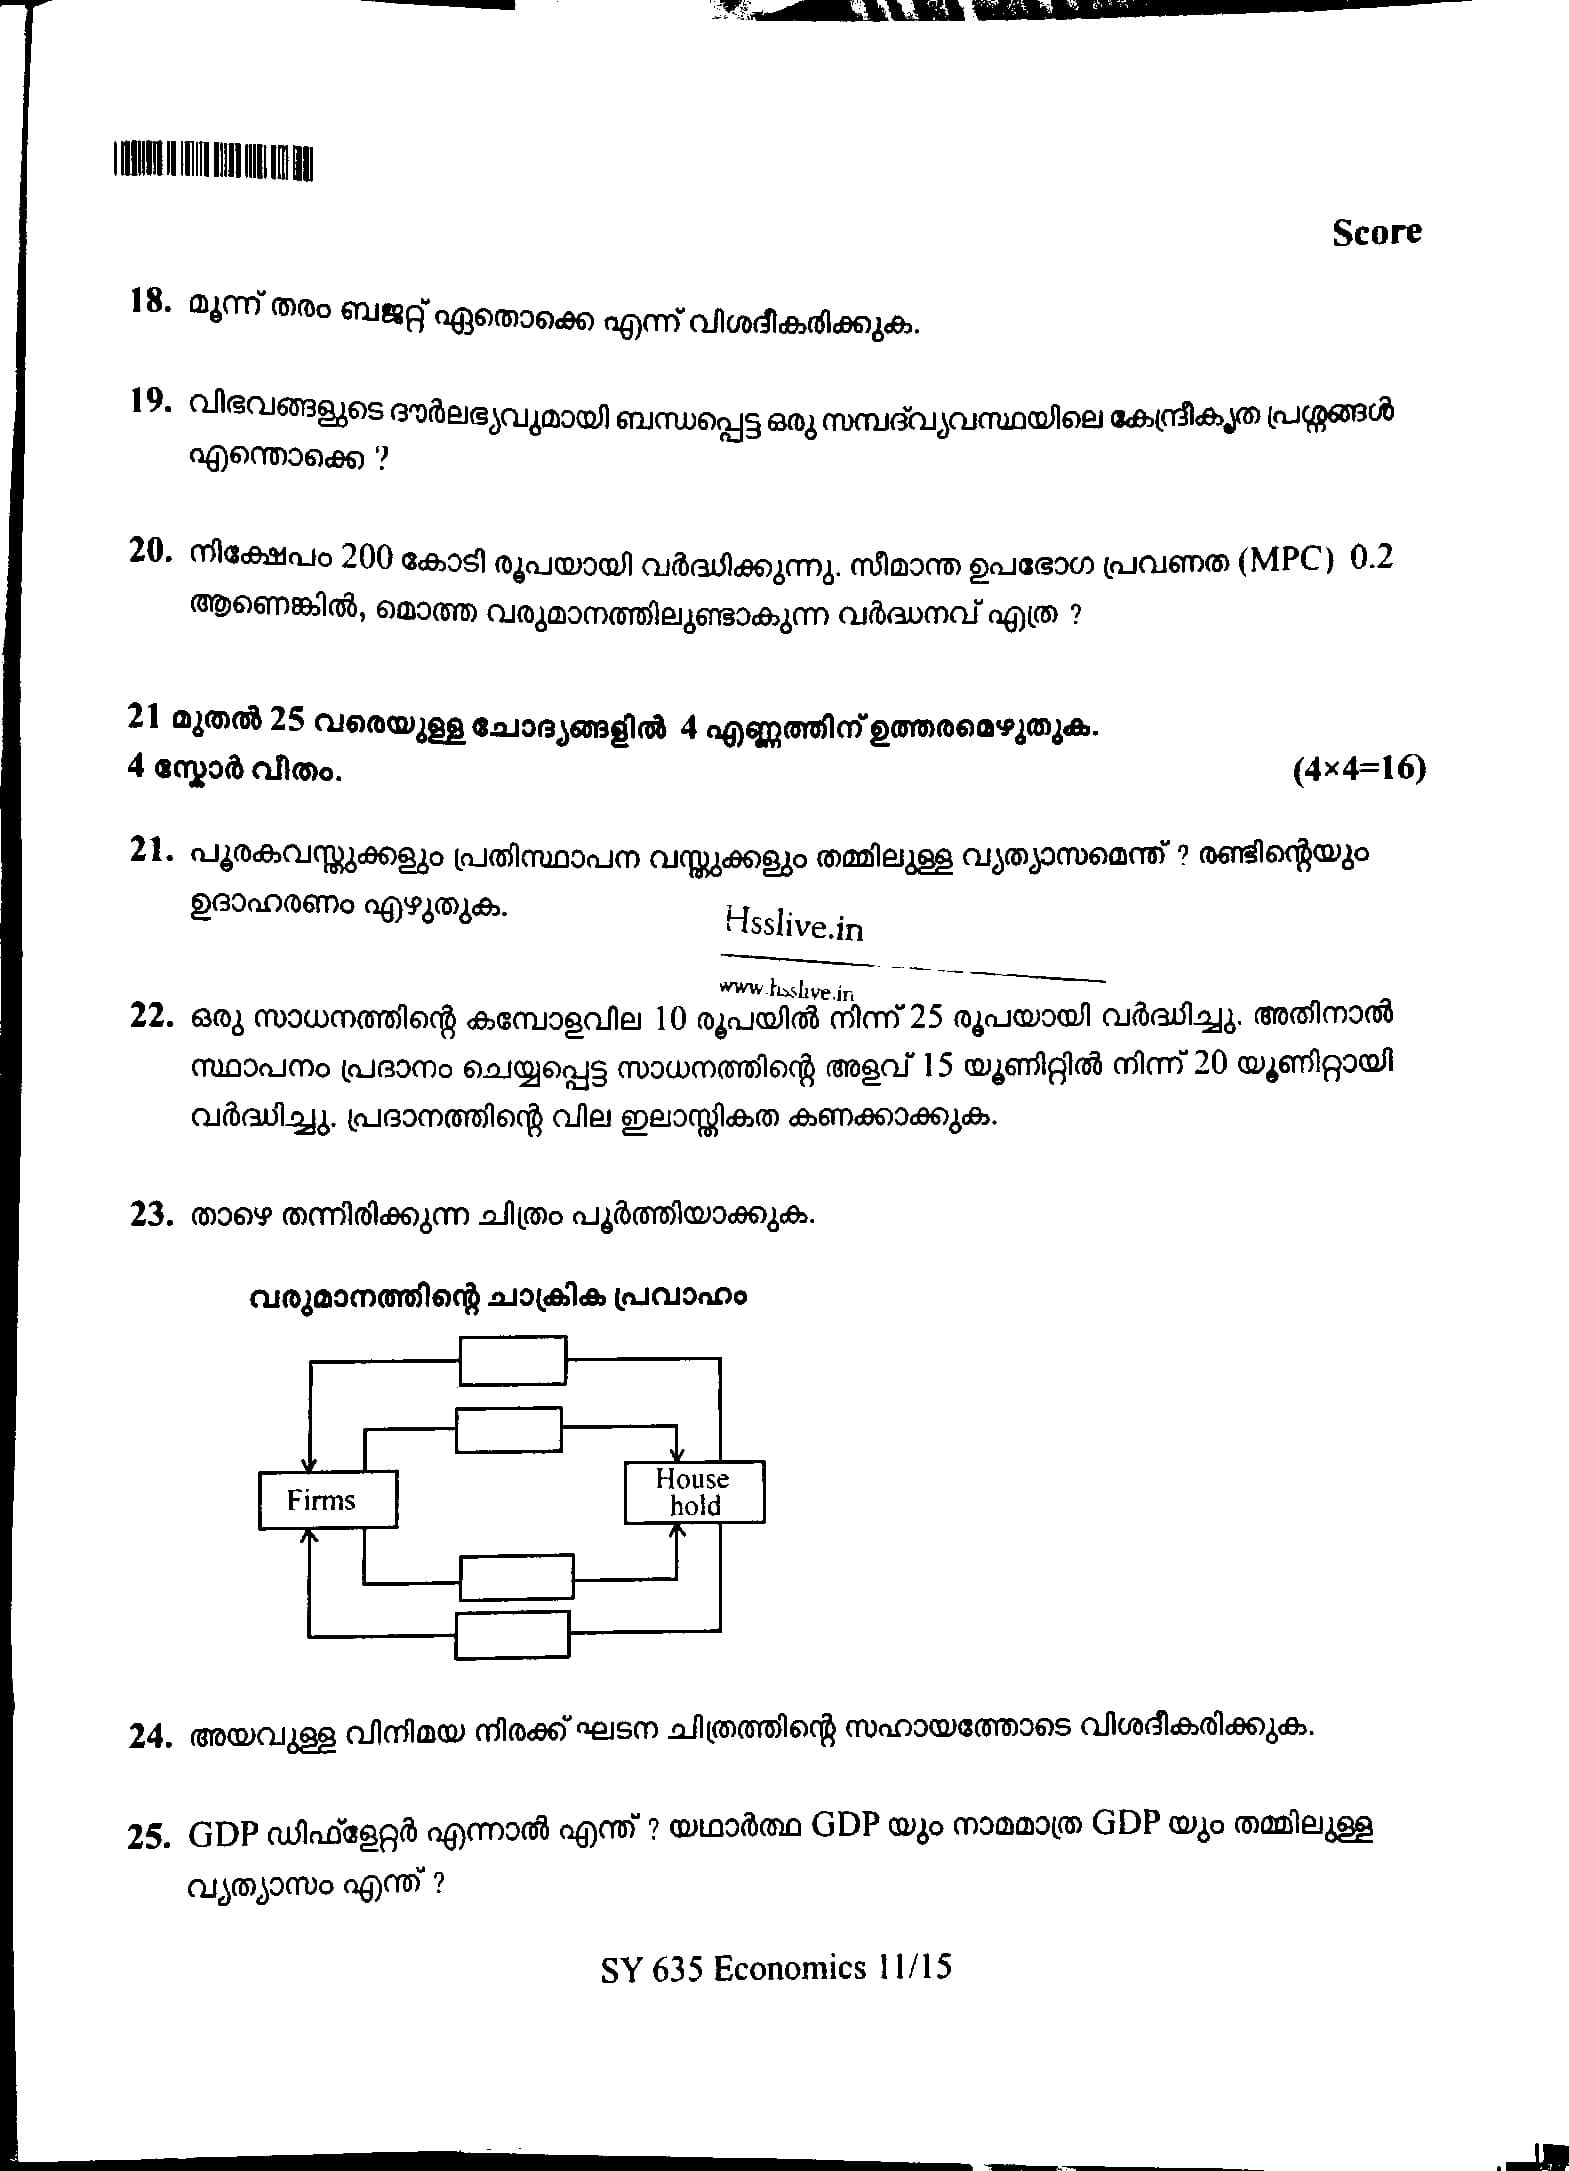
Complete the following chart.

View Solution
The circular flow of income explains the continuous movement of money, goods, and services between households and firms in an economy. The missing components in the given chart can be completed as follows.
Step 1: Flow from Firms to Households (Upper Flow)
Firms provide Goods and Services to households. In return, households make payments for these goods and services.
Step 2: Flow from Households to Firms (Upper Middle Flow)
Households make Consumption Expenditure while purchasing goods and services produced by firms.
Step 3: Flow from Households to Firms (Lower Middle Flow)
Households supply Factors of Production such as land, labour, capital, and entrepreneurship to firms.
Step 4: Flow from Firms to Households (Lower Flow)
In return for factor services, firms pay Factor Payments like wages, rent, interest, and profit to households.
Thus, the correct entries to complete the circular flow chart are:
\[ Goods and Services, \quad Consumption Expenditure, \quad Factors of Production, \quad Factor Payments \] Quick Tip: In a two-sector economy, the circular flow of income involves only households and firms, showing exchange of goods, services, and money.
Diagrammatically explain the flexible exchange rate system.
View Solution
Step 1: Meaning of flexible exchange rate system.
A flexible exchange rate system is one in which the exchange rate of a currency is determined by the forces of demand and supply in the foreign exchange market. There is no direct government intervention to fix the exchange rate.
Step 2: Demand for foreign exchange.
The demand for foreign exchange arises due to imports of goods and services, payment of international debts, tourism, and investment abroad. The demand curve for foreign exchange slopes downward because at a higher exchange rate, foreign goods become costlier, reducing demand.
Step 3: Supply of foreign exchange.
The supply of foreign exchange comes from exports of goods and services, foreign investments, remittances, and tourism receipts. The supply curve slopes upward because a higher exchange rate encourages exporters to supply more foreign exchange.
Step 4: Determination of exchange rate through diagram.
In the diagram, the downward sloping demand curve and upward sloping supply curve intersect at a point. This point of intersection determines the equilibrium exchange rate and equilibrium quantity of foreign exchange. Any excess demand or excess supply leads to automatic adjustment in the exchange rate until equilibrium is restored.
Step 5: Conclusion.
Thus, under a flexible exchange rate system, the exchange rate is determined freely by market forces of demand and supply without government control.
Quick Tip: Flexible exchange rate system is also known as free exchange rate system as prices adjust automatically.
What is GDP deflator? Distinguish between Real GDP and Nominal GDP.
View Solution
Step 1: Meaning of GDP Deflator.
GDP deflator is a price index that measures the change in prices of all final goods and services produced in an economy during a given period. It shows the extent of inflation or deflation in the economy. GDP deflator is calculated as:
\[ GDP Deflator = \frac{Nominal GDP}{Real GDP} \times 100 \]
Step 2: Meaning of Nominal GDP.
Nominal GDP refers to the value of final goods and services produced in an economy measured at current market prices of the same year. It is affected by changes in price level as well as changes in output.
Step 3: Meaning of Real GDP.
Real GDP refers to the value of final goods and services produced in an economy measured at constant prices of a base year. It reflects the true growth of an economy by removing the effect of price changes.
Step 4: Distinction between Nominal GDP and Real GDP.
Nominal GDP is measured at current prices, whereas Real GDP is measured at constant prices. Nominal GDP is influenced by inflation, while Real GDP shows actual growth in production. Nominal GDP may increase even without increase in output, but Real GDP increases only when output rises.
Step 5: Conclusion.
Thus, GDP deflator helps in converting Nominal GDP into Real GDP and provides a clearer picture of economic growth.
Quick Tip: Real GDP is always preferred for comparing economic growth across years.
Differentiate between public goods and private goods. Give examples for each.
View Solution
Goods can be classified based on how they are consumed and the type of benefits they provide. Public goods and private goods are two primary categories with distinct characteristics.
Public Goods:
Public goods are goods that are non-excludable and non-rivalrous. This means that once they are provided, no one can be excluded from using them, and one person’s consumption does not affect another person’s consumption. Public goods are typically provided by the government because they are not profitable for private firms to supply.
Examples: National defense, street lighting, and clean air. These goods are available to everyone, and one person’s use of the good does not diminish another person’s access to it.
Private Goods:
Private goods are excludable and rivalrous. This means that people can be excluded from using the good (e.g., by charging a price), and consumption by one person reduces the quantity available for others. Private goods are typically produced and sold by private firms in the market.
Examples: Food, clothing, and cars. These goods are consumed by individuals, and when one person uses a unit of the good, it is no longer available for others.
Conclusion:
The primary difference between public and private goods lies in their characteristics of excludability and rivalry. Public goods are available to everyone without reducing availability, while private goods are limited to individual consumption.
Quick Tip: Public goods are often funded by taxes because they benefit society as a whole, while private goods are exchanged in the marketplace.
Income of a consumer is Rs. 50. The market price of two goods are Rs. 5 and Rs. 10 respectively.
a) Write the equation of the budget line.
b) Find the vertical intercept and horizontal intercept.
c) Draw the budget line.
View Solution
In microeconomics, the budget line represents the combinations of two goods that a consumer can afford given their income and the prices of those goods. The budget line equation is derived from the consumer’s budget constraint.
a) Equation of the Budget Line:
The budget line can be written as: \[ P_1 X_1 + P_2 X_2 = I \]
where: \( P_1 \) = Price of the first good = Rs. 5, \( P_2 \) = Price of the second good = Rs. 10, \( X_1 \) = Quantity of the first good, \( X_2 \) = Quantity of the second good, \( I \) = Income = Rs. 50.
Substituting the values into the equation: \[ 5X_1 + 10X_2 = 50 \]
b) Finding the Intercepts:
The intercepts are the points where the budget line intersects the axes, representing the quantities of the goods that can be purchased if all income is spent on one good.
Vertical Intercept (when \( X_1 = 0 \)):
Set \( X_1 = 0 \) in the budget line equation: \[ 5(0) + 10X_2 = 50 \] \[ 10X_2 = 50 \quad \Rightarrow \quad X_2 = 5 \]
So, the vertical intercept is at \( X_2 = 5 \).
Horizontal Intercept (when \( X_2 = 0 \)):
Set \( X_2 = 0 \) in the budget line equation: \[ 5X_1 + 10(0) = 50 \] \[ 5X_1 = 50 \quad \Rightarrow \quad X_1 = 10 \]
So, the horizontal intercept is at \( X_1 = 10 \).
c) Drawing the Budget Line:
To plot the budget line, we plot the intercepts on a graph:
- The vertical intercept is at \( X_2 = 5 \) (where all income is spent on the second good).
- The horizontal intercept is at \( X_1 = 10 \) (where all income is spent on the first good).
By joining these two points, we get the budget line that shows all possible combinations of the two goods the consumer can afford given their income.
Quick Tip: The budget line equation shows the trade-off between two goods and helps in understanding consumer choices based on their income and the prices of goods.
Explain market equilibrium with the help of diagram.
View Solution
Market equilibrium occurs when the quantity demanded (\( q_d \)) is equal to the quantity supplied (\( q_s \)) at a specific price level. This price is known as the equilibrium price, and the corresponding quantity is called the equilibrium quantity.
Step 1: Understanding the concept of equilibrium.
In a competitive market, buyers and sellers interact, and the price adjusts to bring the quantity demanded and supplied into balance. The equilibrium point represents this balance, where there is no tendency for the price or quantity to change.
Step 2: Diagram.
The equilibrium point can be shown on a graph, where the demand curve slopes downward (indicating that as price decreases, quantity demanded increases) and the supply curve slopes upward (indicating that as price increases, quantity supplied increases). The point where the demand and supply curves intersect is the equilibrium point, where:
\[ q_d = q_s \quad at price \, P^* \, and quantity \, Q^*. \] Quick Tip: In market equilibrium, at the equilibrium price, the market clears—there is neither a surplus nor a shortage of goods.
Calculate equilibrium price and quantity from the given equation.
View Solution
We are given the following equations for demand and supply:
\[ q_d = 400 - P \] \[ q_s = 200 + P \]
Step 1: Set quantity demanded equal to quantity supplied.
At equilibrium, \( q_d = q_s \), so we set the two equations equal to each other:
\[ 400 - P = 200 + P \]
Step 2: Solve for the equilibrium price \( P^* \).
Rearrange the equation to isolate \( P \):
\[ 400 - 200 = P + P \] \[ 200 = 2P \] \[ P = 100 \]
Thus, the equilibrium price \( P^* = 100 \).
Step 3: Calculate the equilibrium quantity \( Q^* \).
Now that we have \( P = 100 \), substitute it back into either the demand or supply equation to find the equilibrium quantity. Using the demand equation:
\[ q_d = 400 - 100 = 300 \]
Thus, the equilibrium quantity \( Q^* = 300 \).
Quick Tip: At equilibrium, the price and quantity are determined by the intersection of the demand and supply curves.
What is aggregate demand in a two sector economy?
View Solution
Step 1: Definition of Aggregate Demand in a Two-Sector Economy.
In a two-sector economy, aggregate demand refers to the total demand for goods and services in an economy, consisting of consumption demand and investment demand. The two sectors involved are households (consumers) and firms (producers). The aggregate demand in this economy is given by the sum of consumption expenditure (C) and investment expenditure (I).
Step 2: Formula for Aggregate Demand.
\[ AD = C + I \]
Where:
- \(C\) is consumption expenditure, which represents the total spending by households on goods and services.
- \(I\) is investment expenditure, which represents the total spending by firms on capital goods.
Step 3: Conclusion.
Thus, aggregate demand in a two-sector economy is the total demand for goods and services, which comes from both consumption and investment.
Quick Tip: In a two-sector economy, there are no external factors like government or foreign trade, simplifying the calculation of aggregate demand.
Explain the components of aggregate demand.
View Solution
Step 1: Components of Aggregate Demand.
The aggregate demand (AD) consists of four main components:
1. Consumption (C):
Consumption expenditure refers to the total spending by households on goods and services. It is influenced by factors like income, interest rates, and consumer confidence.
2. Investment (I):
Investment expenditure is the spending by businesses on capital goods like machinery, equipment, and buildings. It is influenced by factors such as interest rates, business confidence, and future expectations of profits.
3. Government Spending (G):
Government spending refers to the total expenditure by the government on goods and services, such as infrastructure projects, defense, and public services. This is an important part of aggregate demand, particularly in a mixed economy.
4. Net Exports (NX):
Net exports are the difference between a country's exports (goods and services sold to other countries) and imports (goods and services purchased from other countries). Net exports can either be positive (exports > imports) or negative (imports > exports).
Step 2: Formula for Aggregate Demand.
\[ AD = C + I + G + (X - M) \]
Where:
- \( C \) is consumption expenditure
- \( I \) is investment expenditure
- \( G \) is government spending
- \( (X - M) \) is net exports, with \(X\) representing exports and \(M\) representing imports.
Step 3: Conclusion.
The components of aggregate demand represent the total spending in an economy, and changes in any of these components can affect the overall level of demand and economic activity.
Quick Tip: In an open economy, net exports (exports minus imports) play a crucial role in determining aggregate demand.
What is GDP?
View Solution
Gross Domestic Product (GDP) is one of the most widely used indicators to measure the economic performance of a country. It represents the total monetary or market value of all the final goods and services produced within the geographic boundaries of a country during a specified time period, typically one year or quarter. GDP is an important economic indicator because it serves as a comprehensive measure of a country's overall economic activity.
Step 1: Types of GDP.
There are three different approaches to calculating GDP: the production approach, the expenditure approach, and the income approach.
- The \textit{production approach calculates GDP by summing the value-added to goods and services at each stage of production.
- The \textit{expenditure approach calculates GDP by summing up the total spending on goods and services in the economy, including consumption, investment, government spending, and net exports (exports minus imports).
- The \textit{income approach calculates GDP by summing the total income earned by factors of production, such as wages, rents, interest, and profits.
Step 2: Significance of GDP.
GDP provides valuable insight into the size, health, and overall performance of a nation's economy. It helps policymakers, economists, and businesses understand the economic direction and guide future decisions such as fiscal policies and investments.
Step 3: Formula for GDP.
In its simplest form, GDP can be expressed using the expenditure approach as:
\[ GDP = C + I + G + (X - M) \]
where:
- \(C\) = Consumption (household spending on goods and services)
- \(I\) = Investment (business spending on capital goods)
- \(G\) = Government Spending (expenditures by government on goods and services)
- \(X\) = Exports (goods and services sold abroad)
- \(M\) = Imports (goods and services purchased from abroad)
Quick Tip: GDP is the total output of an economy, often used to determine a country's economic health and growth rate.
Explain the income method for measuring GDP.
View Solution
The income method is one of the three primary methods used to calculate GDP, along with the expenditure and production methods. Under the income method, GDP is calculated by summing up all the income earned by factors of production in the process of producing goods and services in a country. This approach focuses on the incomes generated within the economy, such as wages, profits, rents, and interest. These factor incomes are derived from the production activities that occur within a country’s boundaries.
Step 1: Concept of the Income Method.
The income method calculates GDP by adding up all the incomes received by individuals and businesses in the economy from their participation in the production process. This includes both compensation for the use of factors of production, as well as the income generated by enterprises.
Step 2: Components of the Income Method.
The income method takes into account the following key components:
- Wages and Salaries: Payments to labor for their contribution to the production process, representing the income earned by workers.
- Rent: Payments made for the use of land or other natural resources. Rent is the income earned by landowners for allowing others to use their property.
- Interest: The return earned by capital owners for the use of their capital (e.g., loans or investments). It is income earned by those who provide funds for production.
- Profits: The income earned by entrepreneurs or business owners from their production activities. Profits are the residual income after paying wages, rent, and interest.
Step 3: Calculating GDP using the Income Method.
GDP at factor cost can be calculated as: \[ GDP = Wages + Rent + Interest + Profits \]
This is the total income generated from all factors of production in the economy. However, GDP at factor cost is not directly comparable with GDP at market prices because it does not include taxes and subsidies. To obtain GDP at market price, indirect taxes (such as sales taxes) are added, and subsidies (like agricultural subsidies) are subtracted.
Step 4: Example of GDP Calculation using the Income Method.
Let’s assume the following data for an economy:
- Total wages and salaries: 500 billion
- Total rent earned by landowners: 100 billion
- Total interest earned: 50 billion
- Total profits earned by businesses: 200 billion
Using the formula, GDP at factor cost is: \[ GDP = 500 + 100 + 50 + 200 = 850 billion \]
To convert this into GDP at market prices, we would need to add indirect taxes and subtract subsidies. Suppose the net taxes are 50 billion; then the GDP at market prices would be: \[ GDP = 850 + 50 = 900 billion \]
Step 5: Advantages and Disadvantages of the Income Method.
- Advantages:
- It is based on actual income data, which is often easier to obtain than data on production or expenditure.
- It reflects the distribution of income in the economy and can provide insights into income inequality.
- Disadvantages:
- It can be difficult to account for all income sources, particularly informal or unreported incomes.
- It does not include the value of non-market activities, such as household labor.
Quick Tip: The income method focuses on the earnings derived from production, providing valuable insights into the distribution of wealth within an economy.
Explain the law of variable proportion with suitable diagram.
View Solution
The Law of Variable Proportions, also known as the Law of Diminishing Returns, states that as more and more units of a variable input (like labor) are added to a fixed quantity of other inputs (like capital), the total output will initially increase at an increasing rate, but after a certain point, the output will increase at a decreasing rate, and eventually, the addition of more units of the variable input will result in a decrease in total output. This law is applicable in the short run when at least one factor is fixed.
Stages of the Law of Variable Proportions:
- Increasing Returns (Stage I): In the initial stage, when the variable input is added to the fixed input, the total product increases at an increasing rate. This is because the fixed inputs are underutilized, and additional units of the variable input lead to better utilization of the fixed inputs. The marginal product (MP) is rising during this stage.
- Diminishing Returns (Stage II): After a certain point, additional units of the variable input cause the total product to increase at a decreasing rate. The marginal product starts to fall, though it remains positive. The law of diminishing returns sets in here, and firms should avoid this stage to optimize production.
- Negative Returns (Stage III): If more units of the variable input are added beyond this point, the total product starts to decline, and the marginal product becomes negative. This stage is inefficient and should be avoided.
Diagram:
The following graph shows the relationship between total product (TP) and marginal product (MP) with the number of variable inputs. The TP curve first increases at an increasing rate, then at a decreasing rate, and finally starts to decline, as the MP curve first increases, then decreases, and eventually becomes negative.
Thus, the law of variable proportion explains the relationship between output and input in the short run, demonstrating the phases of increasing, diminishing, and negative returns.
Quick Tip: In the short run, the law of variable proportion suggests that only one factor of production can be increased while others remain fixed.
Explain the relationship between AP and MP.
View Solution
The relationship between Average Product (AP) and Marginal Product (MP) is important in understanding the behavior of production in the short run. Both AP and MP are indicators of the efficiency of production, but they reflect different aspects of output.
Definitions:
- Average Product (AP): The average product refers to the output produced per unit of the variable input. It is calculated as: \[ AP = \frac{Total Product (TP)}{Units of variable input} \]
- Marginal Product (MP): The marginal product refers to the additional output produced by adding one more unit of the variable input while keeping other inputs constant. It is calculated as: \[ MP = \frac{\Delta TP}{\Delta Units of variable input} \]
Relationship between AP and MP:
1. When MP is greater than AP: In the initial stages of production, when more units of the variable input are added, the MP increases and is greater than the AP. In this case, the total output is increasing at an increasing rate, and the AP also increases.
2. When MP equals AP: The point where MP equals AP marks the maximum point of the AP curve. When MP starts to decline but still remains above AP, the AP curve continues to rise, but at a slower rate. At this point, both AP and MP are at their highest.
3. When MP is less than AP: Once the MP falls below the AP, the total product is still increasing, but at a decreasing rate. This is the stage where diminishing returns set in. The AP starts to fall as well, because MP is pulling the average down.
4. When MP becomes negative: If the MP becomes negative, the total product starts to decrease, and so does the AP. This occurs when the variable input is overused relative to the fixed inputs, resulting in inefficient production.
Conclusion:
The AP curve initially rises, reflecting increasing efficiency, and then declines, while the MP curve shows the additional output resulting from each additional unit of input. The relationship between AP and MP helps in understanding the efficiency of production and the stages of returns to scale in production.
Quick Tip: When MP is greater than AP, AP is rising. When MP is less than AP, AP is falling.
What are the features of perfect competition?
View Solution
Perfect competition is a theoretical market structure characterized by a set of specific features. The main features of perfect competition are as follows:
Feature 1: Large number of buyers and sellers.
In a perfectly competitive market, there are many buyers and sellers, each of whom is too small to influence the market price. They are price takers, meaning they accept the market price as given.
Feature 2: Homogeneous products.
All firms in a perfectly competitive market sell identical or homogeneous products. Consumers have no preference for products from one seller over another.
Feature 3: Free entry and exit.
There are no barriers to entry or exit in a perfectly competitive market. Firms can enter or leave the market without any restrictions, leading to normal profits in the long run.
Feature 4: Perfect knowledge.
All buyers and sellers have complete and perfect knowledge of the market conditions, including prices, quality, and availability of goods. This ensures that there are no informational asymmetries.
Feature 5: Price takers.
Both buyers and sellers are price takers, meaning they accept the market price determined by the forces of demand and supply. Individual firms cannot influence the market price by altering their own production.
Feature 6: No government intervention.
In a perfectly competitive market, there is no government intervention such as price controls, subsidies, or regulations. The market operates purely on the basis of supply and demand.
Quick Tip: In perfect competition, firms produce at the lowest possible cost and earn only normal profit in the long run due to free entry and exit.
Explain the conditions required for profit maximisation of a perfectly competitive firm in short run.
View Solution
In the short run, a perfectly competitive firm maximizes profit by adjusting its output level to ensure that marginal cost equals marginal revenue. The following conditions are required for profit maximization:
Step 1: Marginal Cost (MC) equals Marginal Revenue (MR).
For profit maximization, a firm will produce at the output level where its marginal cost (MC) is equal to marginal revenue (MR), i.e.
\[ MC = MR \]
This ensures that the firm is not leaving any potential profit on the table. If \( MC > MR \), the firm should reduce its output, and if \( MC < MR \), the firm should increase its output.
Step 2: Marginal Cost curve above Average Variable Cost curve.
In the short run, the firm should produce at the level where the marginal cost curve intersects the average variable cost curve. This ensures that the firm covers its variable costs and is operating efficiently.
Step 3: Profit Maximization occurs when the firm earns Normal Profit or Supernormal Profit.
In perfect competition, firms can earn supernormal profit in the short run if the market price is greater than average total cost. However, in the long run, firms will enter the market, driving the price down to the point where only normal profits are earned.
Quick Tip: In the short run, profit maximization for a perfectly competitive firm is achieved when \( MC = MR \), and the firm covers its variable costs.
Explain the functions of central bank.
View Solution
The central bank is the institution responsible for managing a country’s monetary and banking system. Its main functions include:
Step 1: Issuing Currency.
The central bank has the exclusive authority to issue currency notes and coins. These are used as legal tender in the economy.
Step 2: Controlling Money Supply.
One of the key functions of the central bank is to control the supply of money in the economy. It does this by using various tools like reserve requirements, open market operations, and the discount rate to influence inflation and stabilize the economy.
Step 3: Regulating Commercial Banks.
The central bank regulates commercial banks by setting interest rates, reserve requirements, and providing them with facilities like the lender of last resort to ensure financial stability.
Step 4: Acting as the Government's Banker.
The central bank acts as the banker to the government, managing the country’s foreign exchange and gold reserves, and conducting government transactions like managing national debt.
Step 5: Managing Foreign Exchange Reserves.
The central bank manages the country’s foreign exchange reserves to stabilize the currency, control exchange rates, and assist in international trade.
Step 6: Conclusion.
The central bank plays a crucial role in maintaining economic stability, managing inflation, and ensuring a smooth functioning of the financial system.
Quick Tip: Central banks have a significant role in controlling inflation and stabilizing the economy by adjusting money supply.
Explain the quantitative and qualitative instruments used by the central bank to control the money supply in the economy.
View Solution
The central bank uses two types of instruments to control the money supply: quantitative and qualitative. These tools help maintain economic stability and control inflation.
Step 1: Quantitative Instruments.
Quantitative instruments affect the overall level of money supply in the economy. The main quantitative tools are:
1. Open Market Operations (OMO):
OMO refers to the buying and selling of government securities in the open market by the central bank. By selling securities, the central bank absorbs money from the economy, and by buying them, it injects money into the economy.
2. Reserve Requirements:
The central bank sets the reserve requirements for commercial banks, specifying the minimum amount of reserves that must be kept against customer deposits. Increasing the reserve requirement reduces the amount of money available for lending, thereby reducing the money supply.
3. Discount Rate:
The discount rate is the interest rate at which commercial banks borrow from the central bank. A higher discount rate discourages borrowing, reducing the money supply, while a lower rate encourages borrowing and increases the money supply.
Step 2: Qualitative Instruments.
Qualitative instruments focus on the allocation of credit rather than the overall supply of money. These include:
1. Credit Rationing:
The central bank may limit the amount of credit extended by banks to certain sectors, such as luxury goods or speculative investments, to prevent inflationary pressures.
2. Moral Suasion:
Moral suasion involves the central bank persuading or advising commercial banks to adopt certain policies that align with monetary control objectives, such as limiting lending in specific sectors.
3. Direct Credit Control:
The central bank may impose direct restrictions on the lending activities of commercial banks, such as limiting the maximum amount of credit that can be extended to certain sectors or activities.
Step 3: Conclusion.
By using a combination of quantitative and qualitative instruments, the central bank can control the money supply, manage inflation, and stabilize the economy.
Quick Tip: While quantitative tools affect the overall money supply, qualitative tools focus on directing credit to particular sectors to ensure balanced economic growth.


Comments