


GATE 2021 Ecology and Evolution (EY) Question Paper with Solutions PDFs can be downloaded from here. On 7th February 2021 IIT Bombay successfully conducted GATE 2021 EY in the forenoon session (9:30 AM to 12:30 PM). There were a total of 65 questions that were distributed in two sections i.e General Aptitude and core EY topics. 10 questions appeared from the General Aptitude section, holding 15% of the total weightage. The rest of the 85% were distributed between core EY topics. The overall difficulty level of the exam was Moderate.
GATE 2021 Ecology and Evolution (EY) Question Paper with Solutions
| GATE 2021 Ecology and Evolution (EY) Question Paper | Check Solutions |

The people _______ were at the demonstration were from all sections of society.
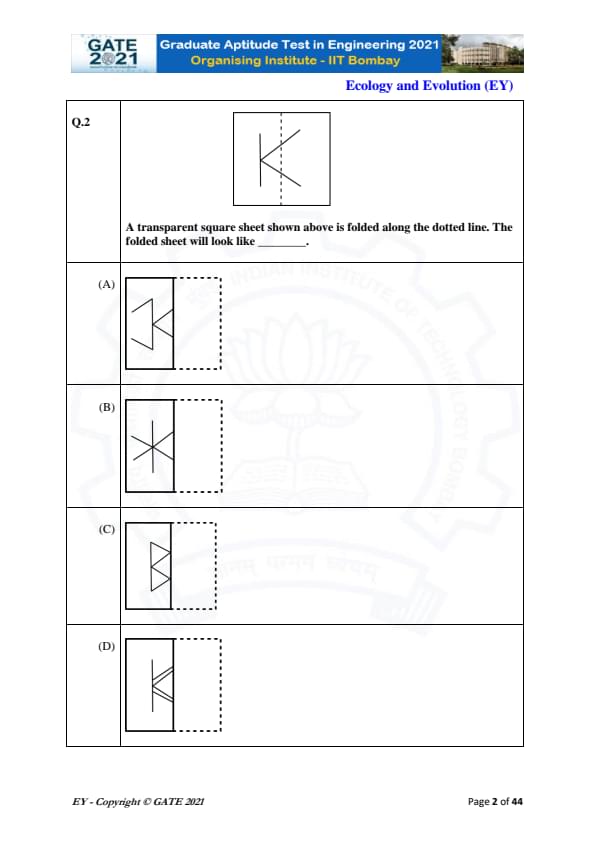
A transparent square sheet shown above is folded along the dotted line. The folded sheet will look like _______.


For a regular polygon having 10 sides, the interior angle between the sides of the polygon, in degrees, is:
Which one of the following numbers is exactly divisible by \(\left(11^{13}+1\right)\)?
Oasis is to sand as island is to _____. Which one of the following options maintains a similar logical relation in the above sentence?
The importance of sleep is often overlooked by students when they are preparing for exams. Research has consistently shown that sleep deprivation greatly reduces the ability to recall the material learnt. Hence, cutting down on sleep to study longer hours can be counterproductive.
Which one of the following statements is the CORRECT inference from the above passage?
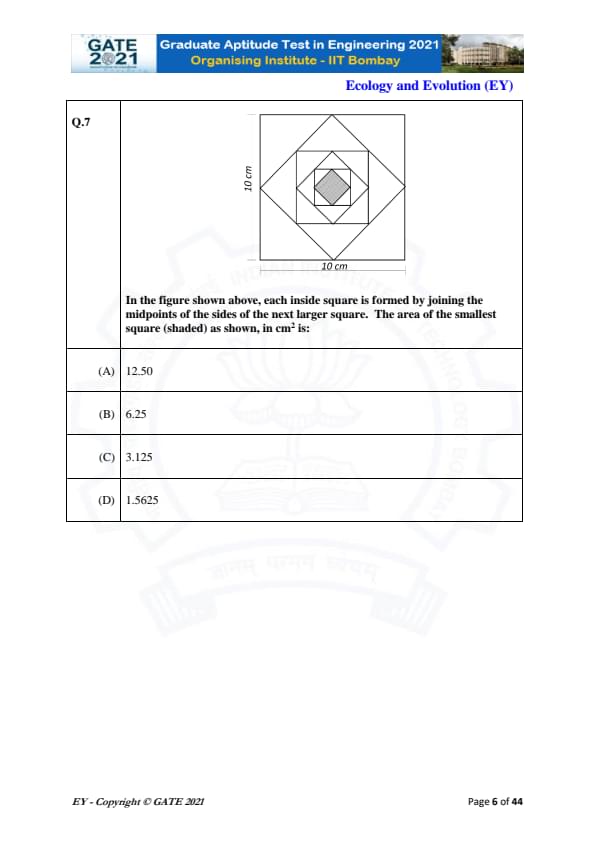
In the figure, each inside square is formed by joining the midpoints of the sides of the next larger square. The area of the smallest shaded square is to be found. The outermost square has a side length of 10 cm.

Let \(X\) be a continuous random variable denoting the temperature measured.
The range of temperature is \([0, 100]\) degree Celsius and the probability density function of \(X\) be \(f(x) = 0.01\) for \(0 \le X \le 100\).
The mean of \(X\) is _______
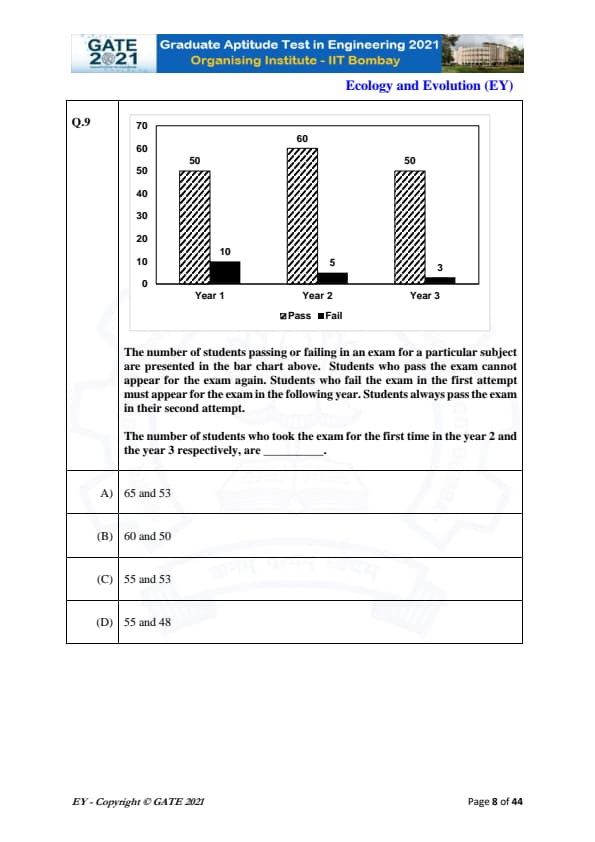
The number of students passing or failing in an exam are shown in the bar chart.
Students who pass do not appear again.
Students who fail must reappear the next year and always pass in their second attempt.
Find the number of students who took the exam for the first time in Year 2 and Year 3.

Seven cars P, Q, R, S, T, U and V are parked in a row not necessarily in that order.
The cars T and U should be parked next to each other.
The cars S and V also should be parked next to each other, whereas P and Q cannot be parked next to each other.
Q and S must be parked next to each other.
R is parked to the immediate right of V.
T is parked to the left of U.
Based on the above statements, the only INCORRECT option is:
Animal species can vary in whether dispersal is more likely among male offspring (male-biased), female offspring (female-biased), or similar between the sexes. Dispersal in birds and mammals is most commonly:
Of the following, which one is the most direct measure of Darwinian fitness?
The marginal value theorem in optimal foraging theory examines which one of the following foraging decisions?
Which one of the following shows the highest degree of endemism?
Which one of the following Mendelian disorders is influenced by diet?
Which one of the following mammalian DNA regions exhibits the highest level of sequence variation?
Which one of the following makes a species most vulnerable to extinction?
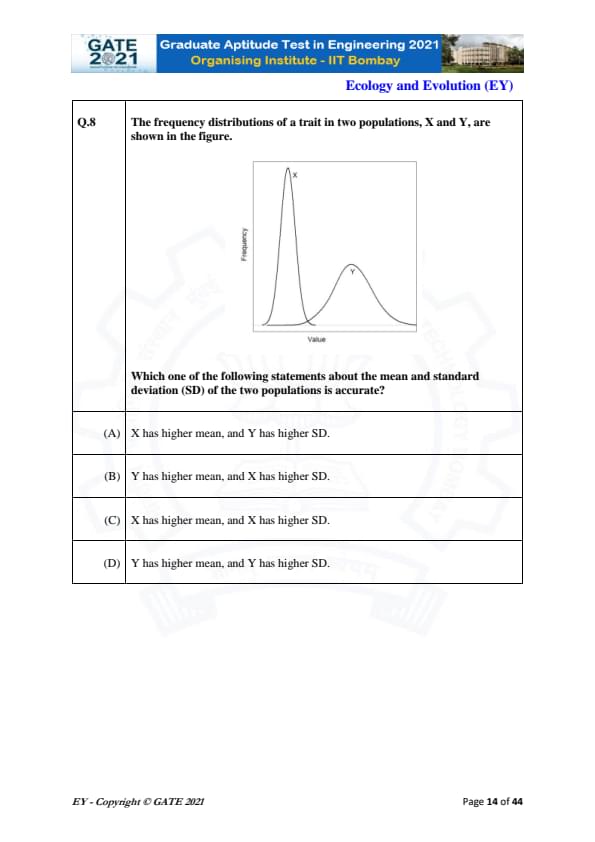
The frequency distributions of a trait in two populations, X and Y, are shown in the figure.

Which one of the following statements about the mean and standard deviation (SD) of the two populations is accurate?
Two sister species of bulbuls have non-overlapping distributions. One is distributed in India and the other in Sri Lanka. Which of the following modes of speciation is the most parsimonious explanation for this pattern?
In an Arctic Ocean food chain, killer whales feed on sea otters, which feed on sea urchins, which in turn feed on kelp (a type of seaweed). An increase in the abundance of killer whales causes sea otter abundance to decline, leading to higher sea urchin densities, which in turn reduces the abundance of kelp. Which of the following terms describes this phenomenon?
Listed below are hypotheses for the evolution of monogamy. Which one of these is NOT based on the concept of individual selection?
Rising temperature due to global warming can stimulate decomposition of organic matter and release CO\(_2\) into the atmosphere. This is an example of
Ant-mimic spiders of the genus Myrmarachne are known for which one of the following evolutionary phenomena?
The probability of local extinction increases with body size when there is forest degradation, loss, and fragmentation. Consider the following hypotheses for the vulnerability of larger-bodied species:
(P) Larger-bodied species tend to have smaller population sizes.
(Q) Larger-bodied species require larger territories/home ranges.
(R) Larger-bodied species have higher absolute resource and energy requirements.
Which one of the following options correctly lists all potential reasons for the vulnerability of larger-bodied species?
Grazing by large mammalian herbivores can have a strong influence on ecosystem structure, and can cause ecosystems to transition between alternative states over decades. Which one of the following transitions can result from grazing?
The effective population size of a sexually reproducing, diploid, animal species will be highest when the sex ratio (number of reproducing males / number of reproducing females) is
The theory of evolution by natural selection was proposed by which one (or more) of the following?
According to the MacArthur – Wilson equilibrium model of island biogeography, which one (or more) of the following factors affect(s) extinction rate on an island?
A sample of heights of trees follows a normal distribution. In this sample, 68% of height measurements are expected to fall in the interval: \[ mean \pm \_\_\_ standard deviation. \]
(Round off to the nearest integer.)
A bird species has an annual survival probability of 0.30. While sampling the population of this species, the probability that any individual is captured in a given year is 0.40. A bird is captured, tagged, and released in Year one. The probability that it is re-captured in Year two is ___ (Round off to two decimal places.)
Sex ratio at birth is biased towards females in a mongoose population. If the probability of having a daughter is 0.7 in this population, and if sex determination of each offspring is an independent event, then the probability that a female with a litter of four offspring has at least one son is ___ (Round off to two decimal places.)
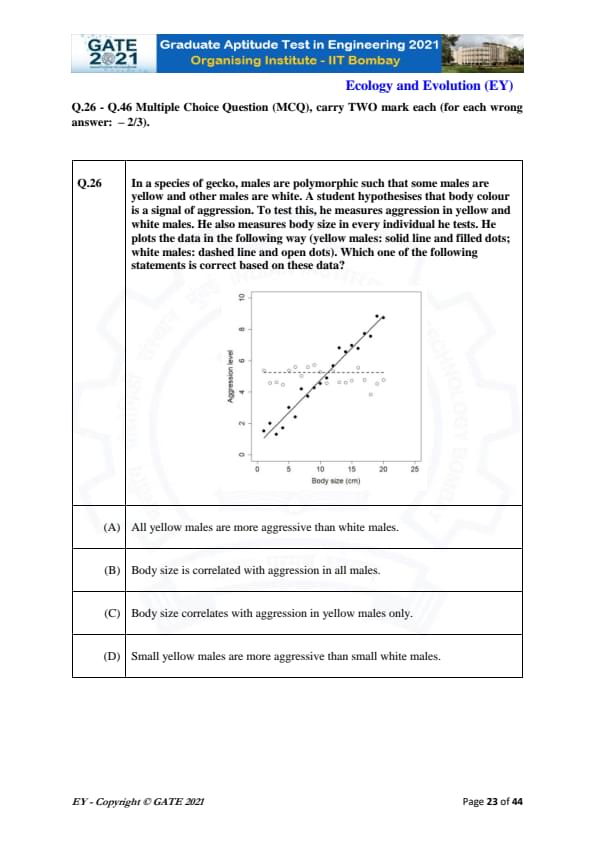
In a species of gecko, males are polymorphic such that some males are yellow and other males are white. A student hypothesises that body colour is a signal of aggression. To test this, he measures aggression in yellow and white males. He also measures body size in every individual he tests. He plots the data in the following way (yellow males: solid line and filled dots; white males: dashed line and open dots). Which one of the following statements is correct based on these data?

Homing pigeons can perceive the pattern of polarized light in the sky (which depends on the position of the sun relative to the earth). This enables homing pigeons to orient and navigate home if released in any location. One can reset their biological clock in captivity by artificially controlling the light conditions. If you acclimatize a pigeon to a new lighting cycle with "sunrise" at 6 PM and "sunset" at 6 AM, instead of 6 AM sunrise and 6 PM sunset that naturally occurs, the bird will be clock-shifted by 12 hours within a few days. Suppose you release two birds, a normal bird (N) and a 12-hr clock-adjusted bird (C), 30 km East of their home at 6 AM. In which direction will each bird fly?
Demographic stochasticity introduces random variation in population growth because
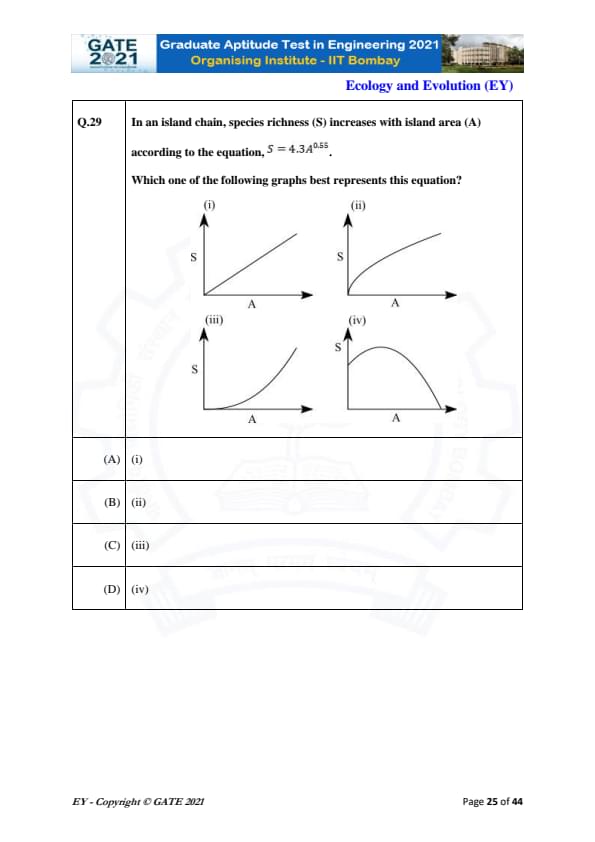
In an island chain, species richness (S) increases with island area (A) according to the equation, \(S = 4.3A^{0.55}\).
Which one of the following graphs best represents this equation?

A researcher measures the abundance of a tree species in 10 plots in each of two habitats. She tests for differences in abundance between the two habitats using an ANOVA. The results from the ANOVA are as follows:
Mean abundance in habitat A = 30 trees
Mean abundance in habitat B = 50 trees
F-statistic (on 1 and 18 degrees of freedom) = 6.04
P-value = 0.02
Here, a P-value of 0.02 means that:
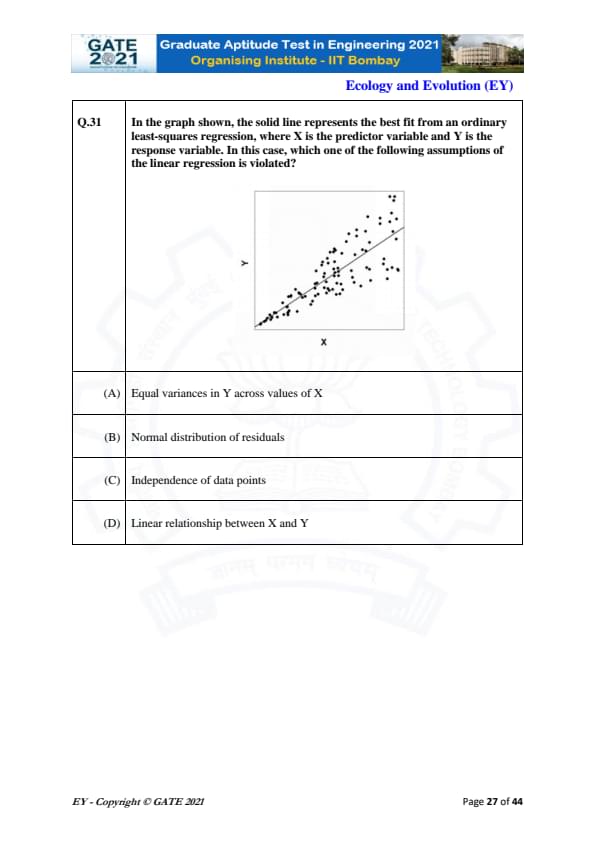
In the graph shown, the solid line represents the best fit from an ordinary least-squares regression, where X is the predictor variable and Y is the response variable. In this case, which one of the following assumptions of the linear regression is violated?

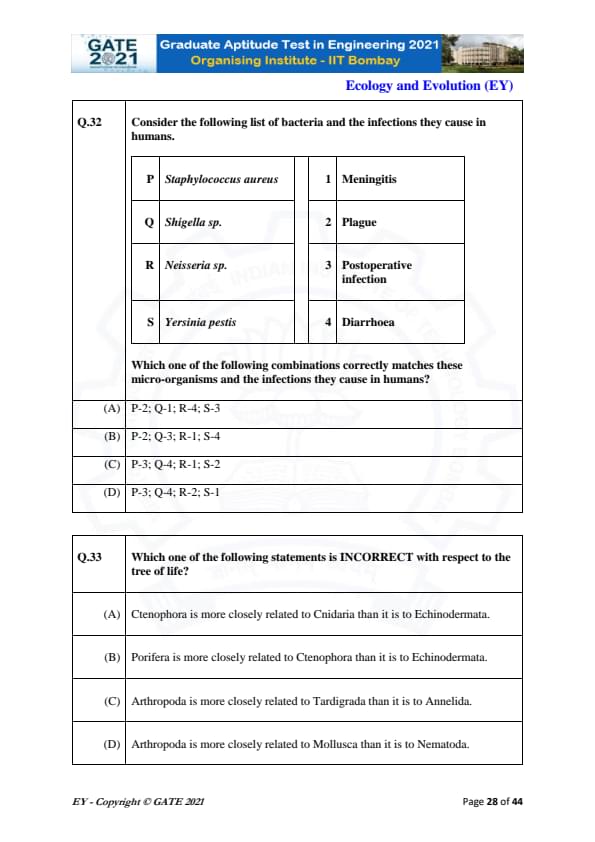
Consider the following list of bacteria and the infections they cause in humans.

Which one of the following combinations correctly matches these micro-organisms and the infections they cause in humans?
Which one of the following statements is INCORRECT with respect to the tree of life?
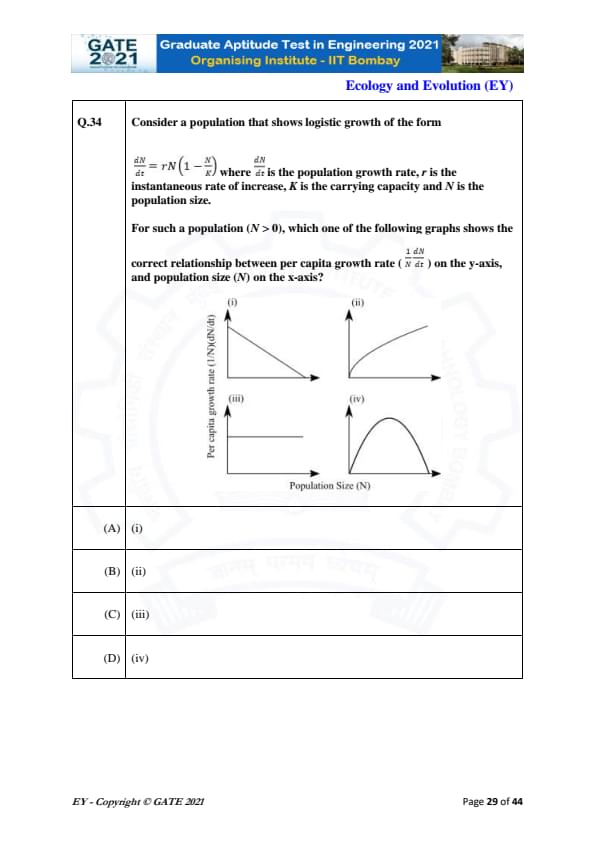
Consider a population that shows logistic growth of the form
\[ \frac{dN}{dt} = rN \left( 1 - \frac{N}{K} \right) \]
where \(\frac{dN}{dt}\) is the population growth rate, \(r\) \text{is the instantaneous rate of increase, \(K\) \text{is the carrying capacity and N \text{is the population size.
For such a population (N > 0), which one of the following graphs shows the correct relationship between per capita growth rate \(\frac{1{N} \frac{dN}{dt}\) on the y-axis, and population size (N) on the x-axis?

Which one of the following represents the correct chronological order of geological periods (from oldest to most recent)?
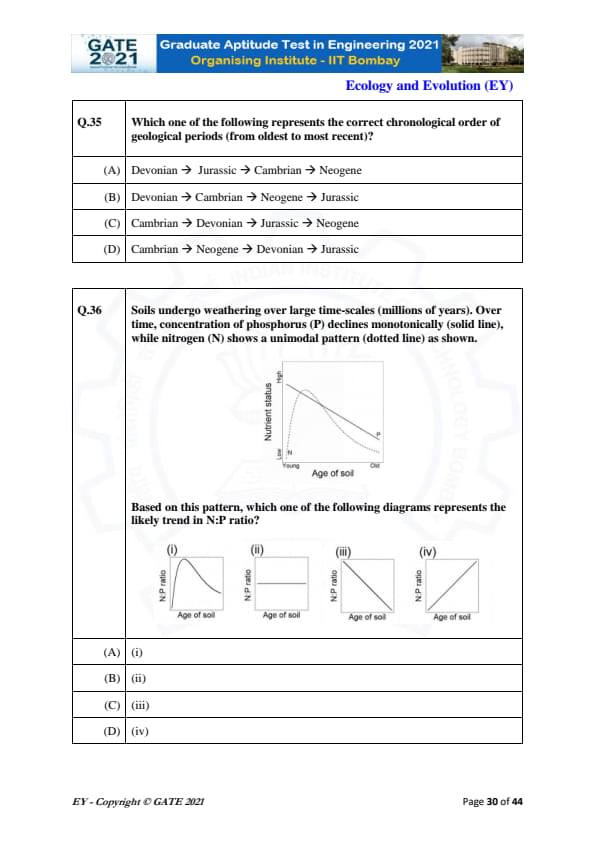
Soils undergo weathering over large time-scales (millions of years). Over time, concentration of phosphorus (P) declines monotonically (solid line), while nitrogen (N) shows a unimodal pattern (dotted line) as shown.

Based on this pattern, which one of the following diagrams represents the likely trend in N:P ratio?

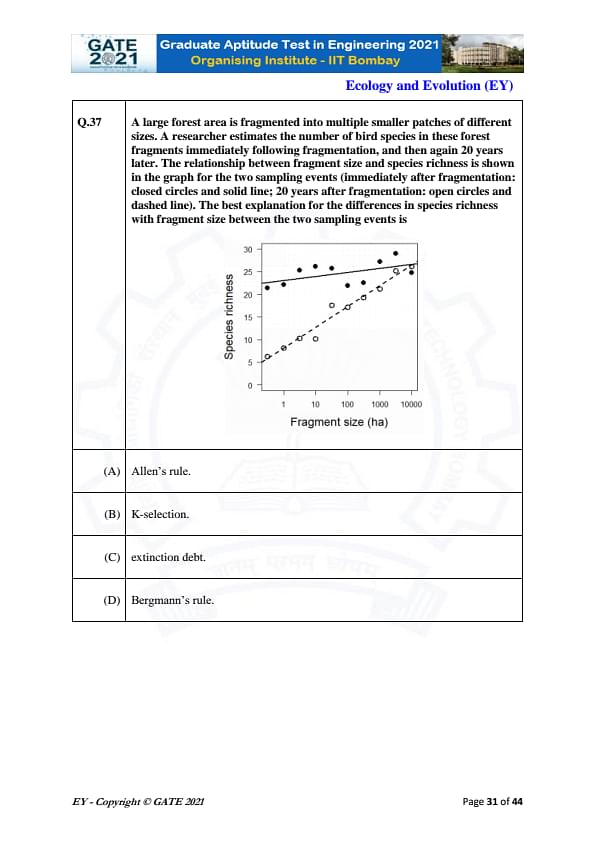
A large forest area is fragmented into multiple smaller patches of different sizes. A researcher estimates the number of bird species in these forest fragments immediately following fragmentation, and then again 20 years later. The relationship between fragment size and species richness is shown in the graph for the two sampling events (immediately after fragmentation: closed circles and solid line; 20 years after fragmentation: open circles and dashed line). The best explanation for the differences in species richness with fragment size between the two sampling events is

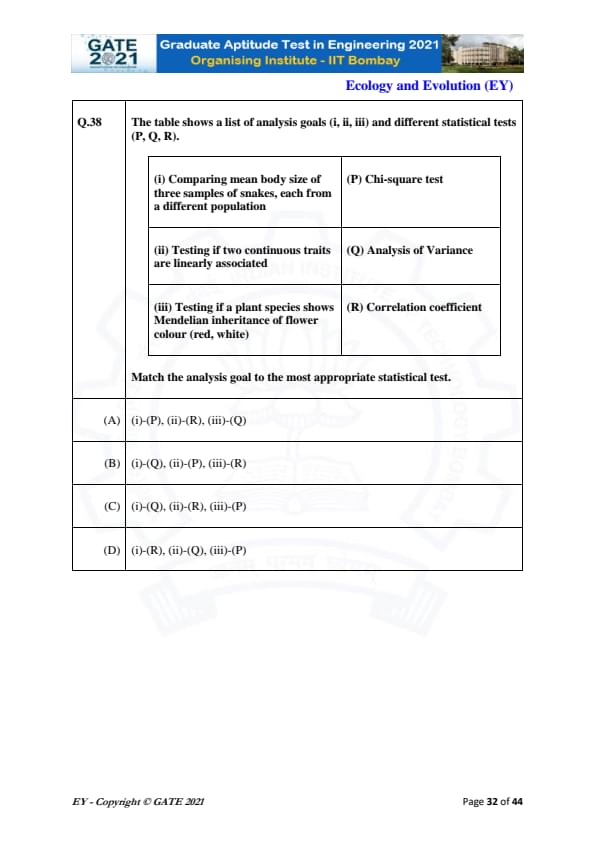
The table shows a list of analysis goals (i, ii, iii) and different statistical tests (P, Q, R).

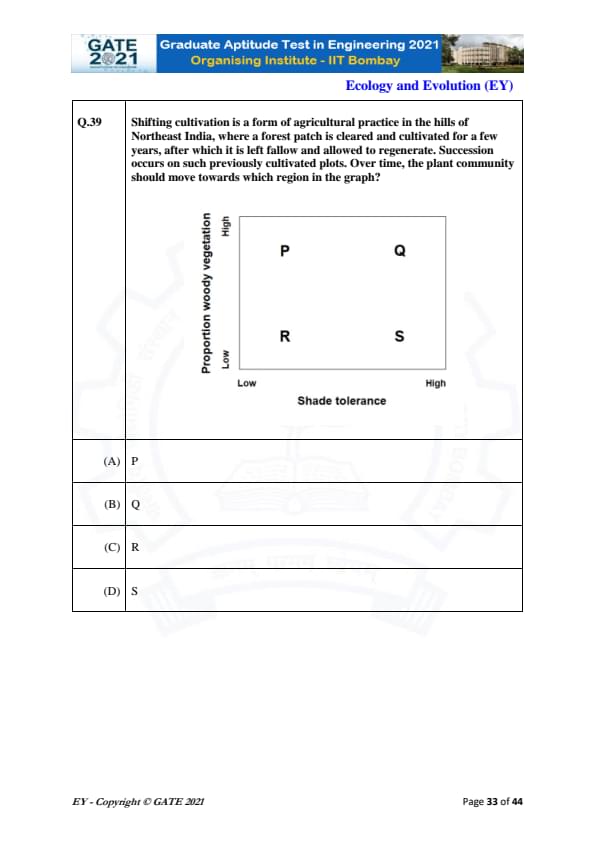
Shifting cultivation is a form of agricultural practice in the hills of Northeast India, where a forest patch is cleared and cultivated for a few years, after which it is left fallow and allowed to regenerate. Succession occurs on such previously cultivated plots. Over time, the plant community should move towards which region in the graph?

Consider 1000 terrestrial species that have geographical ranges of different shapes and sizes. If the Earth were entirely covered by land (no oceans), and the ranges of these species were overlaid on the surface of the Earth at random, which one of the following patterns is expected?
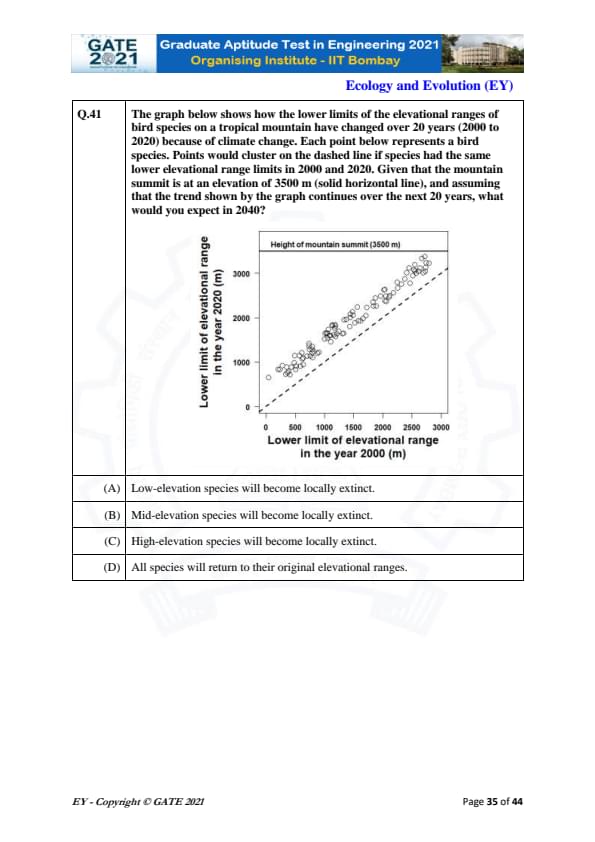
The graph below shows how the lower limits of the elevational ranges of bird species on a tropical mountain have changed over 20 years (2000 to 2020) because of climate change. Each point below represents a bird species. Points would cluster on the dashed line if species had the same lower elevational range limits in 2000 and 2020. Given that the mountain summit is at an elevation of 3500 m (solid horizontal line), and assuming that the trend shown by the graph continues over the next 20 years, what would you expect in 2040?

Behavioural ecologists exploring a newly discovered island find 20 new species of terrestrial lizards. Males of these species have a dorsal ridge that varies in size from large in some species to entirely lacking in others. The scientists hypothesise that dorsal ridges in males evolved by runaway sexual selection stemming from sensory bias in females. Which one of the following would provide the necessary evidence to support this hypothesis?
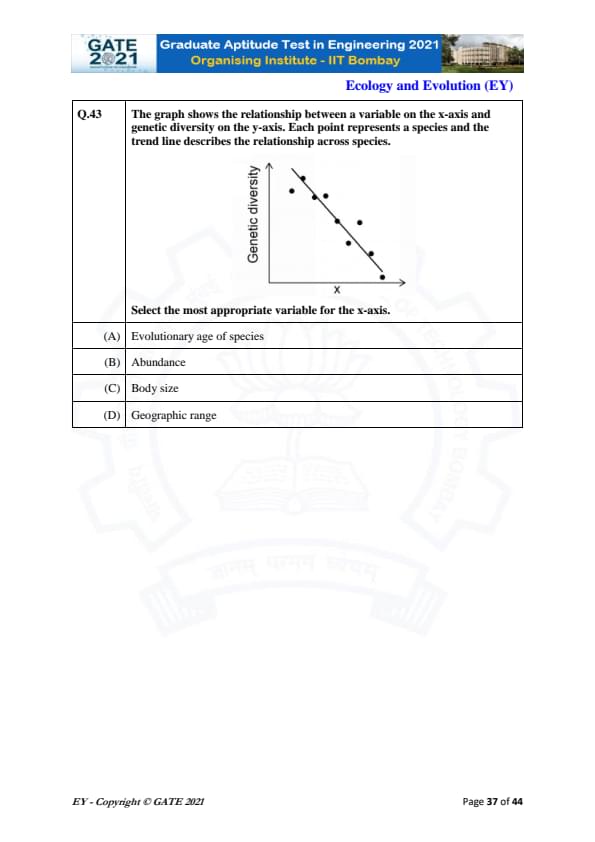
The graph shows the relationship between a variable on the x-axis and genetic diversity on the y-axis. Each point represents a species and the trend line describes the relationship across species.

Select the most appropriate variable for the x-axis.
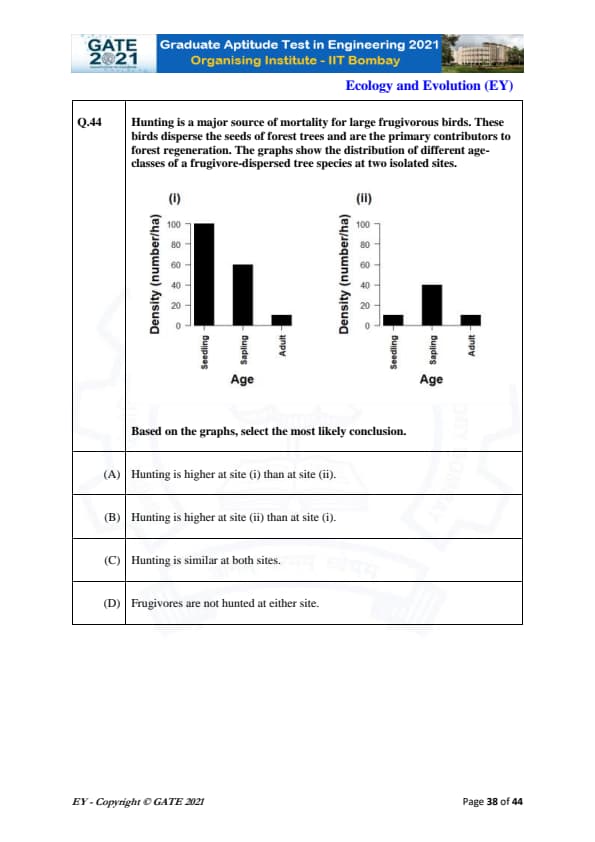
Hunting is a major source of mortality for large frugivorous birds. These birds disperse the seeds of forest trees and are the primary contributors to forest regeneration. The graphs show the distribution of different age-classes of a frugivore-dispersed tree species at two isolated sites.

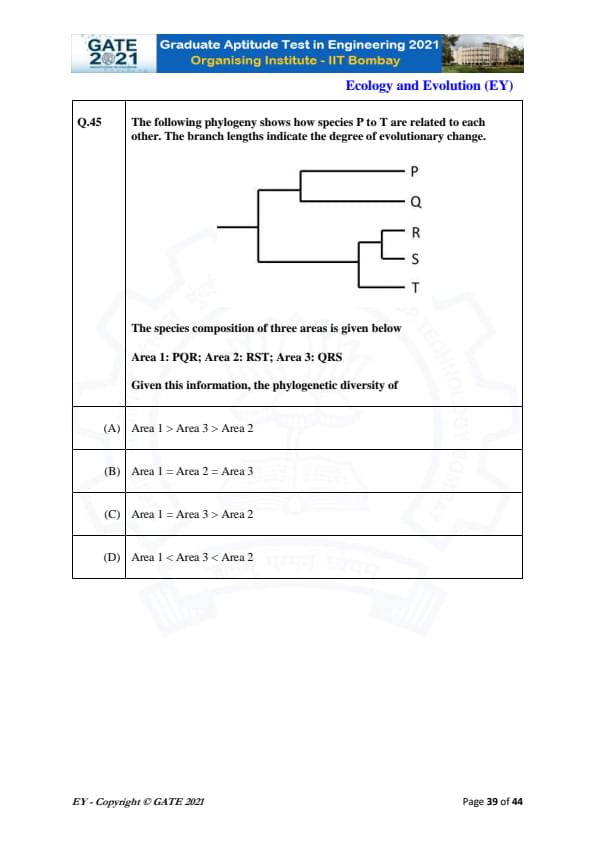
The following phylogeny shows how species P to T are related to each other. The branch lengths indicate the degree of evolutionary change.

The species composition of three areas is given below:
Area 1: PQR; Area 2: RST; Area 3: QRS
Given this information, the phylogenetic diversity of
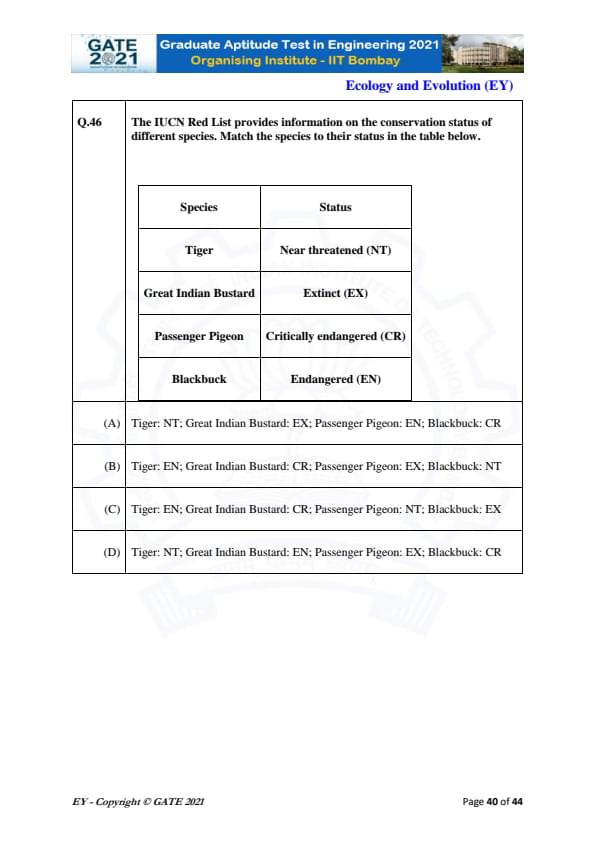
The IUCN Red List provides information on the conservation status of different species. Match the species to their status in the table below.

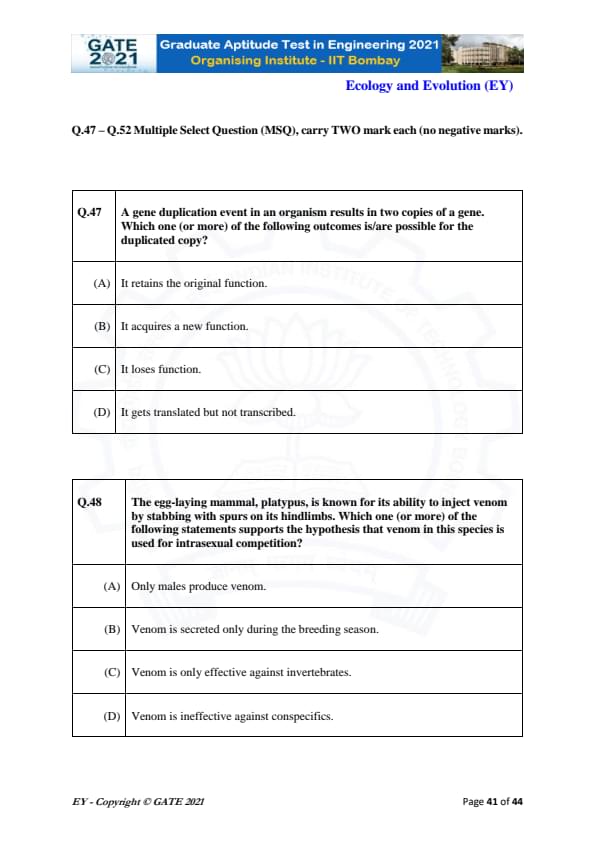
A gene duplication event in an organism results in two copies of a gene. Which one (or more) of the following outcomes is/are possible for the duplicated copy?
The egg-laying mammal, platypus, is known for its ability to inject venom by stabbing with spurs on its hindlimbs. Which one (or more) of the following statements supports the hypothesis that venom in this species is used for intrasexual competition?
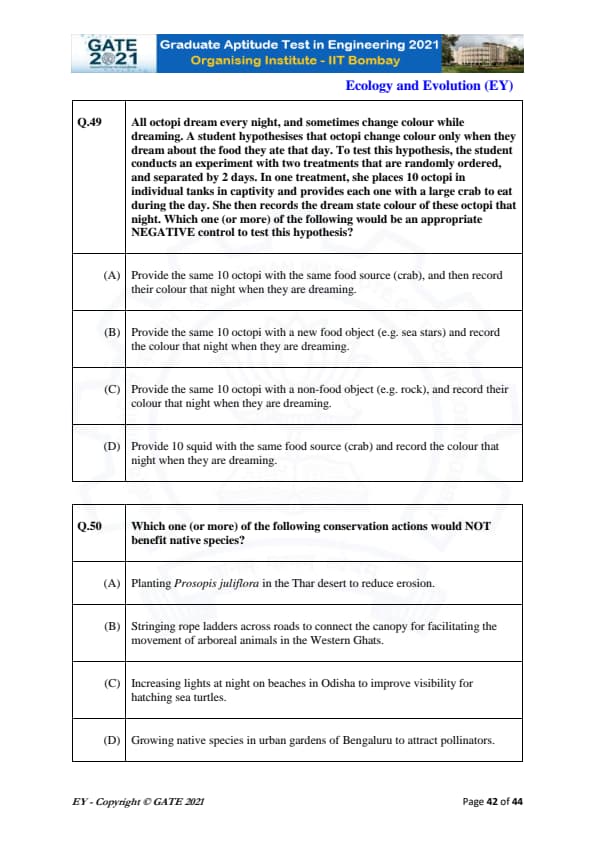
All octopi dream every night, and sometimes change colour while dreaming. A student hypothesises that octopi change colour only when they dream about the food they ate that day. To test this hypothesis, the student conducts an experiment with two treatments that are randomly ordered, and separated by 2 days. In one treatment, she places 10 octopi in individual tanks in captivity and provides each one with a large crab to eat during the day. She then records the dream state colour of these octopi that night. Which one (or more) of the following would be an appropriate NEGATIVE control to test this hypothesis?
Which one (or more) of the following conservation actions would NOT benefit native species?
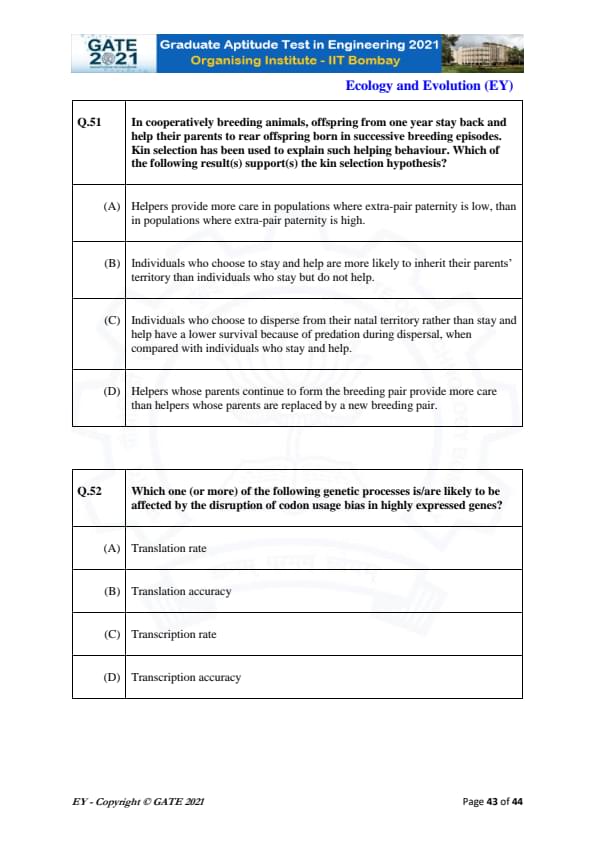
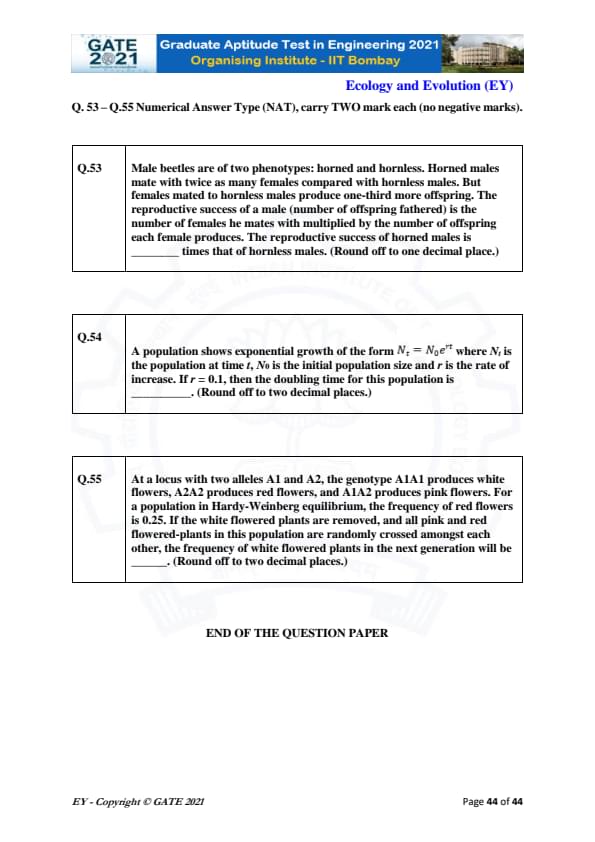
Male beetles are of two phenotypes: horned and hornless. Horned males mate with twice as many females compared with hornless males. But females mated to hornless males produce one-third more offspring. The reproductive success of a male (number of offspring fathered) is the number of females he mates with multiplied by the number of offspring each female produces. The reproductive success of horned males is ____ times that of hornless males. (Round off to one decimal place.)
A population shows exponential growth of the form \( N_t = N_0 e^{rt} \) where \( N_t \) is the population at time \( t \), \( N_0 \) is the initial population size, and \( r \) is the rate of increase. If \( r = 0.1 \), then the doubling time for this population is ____ (Round off to two decimal places.)
At a locus with two alleles A1 and A2, the genotype A1A1 produces white flowers, A2A2 produces red flowers, and A1A2 produces pink flowers. For a population in Hardy-Weinberg equilibrium, the frequency of red flowers is 0.25. If the white-flowered plants are removed, and all pink and red flowered-plants in this population are randomly crossed amongst each other, the frequency of white flowered plants in the next generation will be ____ (Round off to two decimal places.)
Quick Links:
GATE 2021 EY Paper Analysis
IIT Bombay modified the exam pattern of GATE 2021 exams. IIT Bombay introduced MSQs in GATE 2021 exams. MSQs comes with more or more than one correct answer.
Have a look at the below-mentioned table to get the question frequency of NATs, MCQs, and MSQs-
| Type of Questions | No. Of Questions Asked | Carried Marks |
|---|---|---|
| No. of 1 mark MCQs | 21 | 21 |
| No. Of 2 marks MCQs | 26 | 52 |
| No. Of 1 mark MSQs | 6 | 6 |
| No. Of 2 marks MSQs | 6 | 12 |
| No. Of 1 mark NATs | 3 | 3 |
| No. Of 2 marks NATs | 3 | 6 |
- General Aptitude section was accountable for a total of 10 questions out of 65 questions that were easy to attempt
- The remaining 55 questions related to EY section, that were of moderate level
- The contribution of NATs (Numerical Answer Types) questions was the least in GATE 2021 EY
- MSQs (Multiple Select Questions) contributed 12 questions, carried a total of 18 marks
- MCQs made the most significant contribution of 73% weightage in GATE 2021 EY
Also Check:
GATE 2021 EY Exam Pattern and Marking Scheme
The exam pattern would remain the same as previous years. 1 or 2 marks would be rewarded for each correct answer. ⅓ or ⅔ marks would be reduced for every question carrying 1 or 2 marks. Negative marking scheme is only limited to MCQs. However, NATs and MSQs are exempted from the list of negative marking.
- A candidate must attempt more than 45 questions to score more than 70 marks which is considered a good score in GATE 2021 EY
GATE Previous Year Question Papers:
| GATE 2022 Question Papers | GATE 2021 Question Papers | GATE 2020 Question Papers |
| GATE 2019 Question Papers | GATE 2018 Question Papers | GATE 2017 Question Papers |


Comments