


NTA has officially released the number of candidates appeared for JEE Main 2026 from 21 to 28 January. As per the official report (from Jan 21 to Jan 28), a total of 13,00,368 students appeared, with an attendance record of 96.26%.
- JEE main 2026 exam for 28th January was scheduled for 13,50,969 students
- The number of students appeared till 28th January was 13,00,368
- NTA noted an attendance rate of 96.26% on 21-28 January 2026 JEE Main exams.
- JEE Main exam was Scheduled for 21, 22, 23, and 24 January 2026 for 10,76,486 candidates.
- As per the NTA reports, 10,36,211 appeared for JEE Main 2026 on 21-24 January.
- 96.19% candidates were Aadhar verified, and 3453 students were PWD candidates.
 Source: NTA Official X Post
Official statistics for the category wise number of students appeared for JEE Main 2026 are yet to be released. NTA will publish the statistics at the time of releasing the JEE Main result 2026.
JEE Main registration 2026 for session 2 will open soon on the official website. You can register using the link below once released.
| Direct link to register for JEE Main 2026 Session 2 - (Soon) |
Last year, a total of 15,39,848 candidates registered for the JEE Main Exam of which 14,75,103 appeared. Among these, in January session 13,11,544 students registered and 12,58,136 appeared. For the April session 10,61,840 registrations and 9,92,350 appeared.
- In 2025, the attendance rate for JEE Main session 1 was 95.93% and in session 2 was 93.45%.
- In 2024, a total of 14,15,110 students had appeared out of the 1,476,557 unique registrations in both sessions for paper 1 B.E/ B.Tech.

Must Check:
Number of Students Appeared for JEE Main 2026
As per the analysis by experts, this year, total number of students registered for JEE Main Session 1 is likely 14,50,000+. The number of students is likely 1-1.5 lakh more than last years’ JEE Main Session 1 statistics.
In a post on X, NTA released the statistics of the number of students appeared and the attendance rate during JEE Main 2026 examination on 21, 22, 23, and 24 January 2026. You can go through the table below to check the number of students appeared in JEE Main 2026.
|
Particulars |
Candidate’s stats (Jan 21, 22, and 23 all shifts) |
|---|---|
|
Scheduled candidates |
8,01,326 |
|
Candidates appeared |
7,70,441 |
|
Attendance (%) |
96.15% |
|
Aadhar Verified Candidates |
7,40,412 |
|
Aadhar Verification % |
96.10% |
|
PwD candidates |
2563 |
Source: NDTV Education Official
| Particulars | Candidate’s stats (Till 24th january, 2026) |
|---|---|
| Number of Candidates Scheduled | 10,76,486 |
| Number of Students Appeared | 10,36,211 |
| JEE Main Attendance Rate 2026 | 96.26% |
| Aadhar Verified Candidates | 996774 |
| Percentage of Aadhar Verified Candidates | 96.19% |
| PwD Candidates | 3453 |
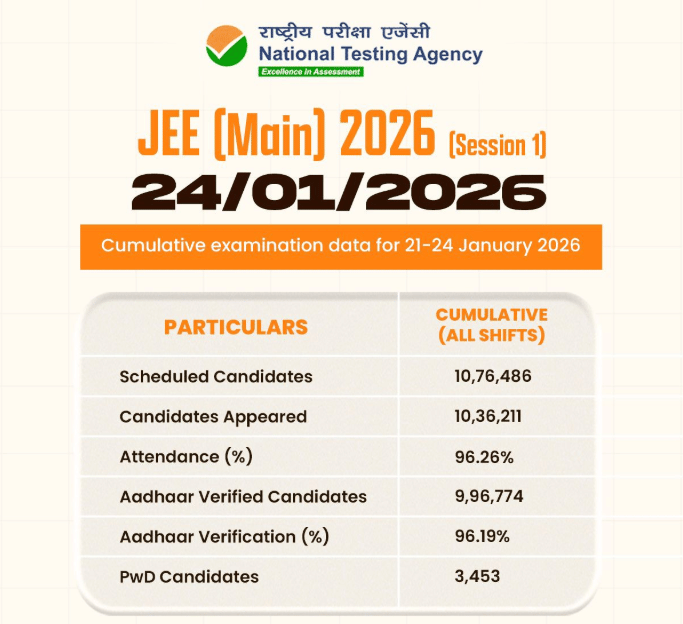
Source: @NTA Official X Post
| Particulars | Candidate’s stats (Till 28th January, 2026) |
|---|---|
| Number of Candidates Scheduled | 13,50,969 |
| Number of Students Appeared | 13,00,368 |
| JEE Main Attendance Rate 2026 | 96.26% |
| PwD Candidates | 4314 |
In a YouTube Video, Harsh Sir, Vedantu Tutor Noted that due to fixed number of JEE Main seats (around 2,50,000) and increasing number of registering and appearing students, JEE Main cutoff will rise.
You can go through the video below to know how number of students has increased in past years and its effect on JEE Main cutoff.
Trend of Students Appeared in JEE Main (2020-2025) with 2026 Prediction
This table shows the year-wise unique students who appeared across both sessions, based on NTA data, with a projected estimate for 2026 derived from registration trends and growth patterns.
| Year | Unique Students Appeared | Growth from Previous Year |
|---|---|---|
| 2020 | 10,23,000 | - |
| 2021 | 9,39,008 | -8.2% |
| 2022 | 9,05,590 | -3.5% |
| 2023 | 11,13,325 | +22.9% |
| 2024 | 14,15,110 | +27.1% |
| 2025 | 14,75,103 | +4.2% |
| 2026 (Predicted) | 15,50,000 | +5.1% |

JEE Main (2024-2026) Session-Wise Statistics for and Appearance Rates
This table compares registrations and appearance rates for recent years, with a forecast for 2026 based on early registration data (13.8 lakh for Session 1) and historical attendance trends.
| Year | Session 1 Registered | Session 1 Appeared | Session 2 Registered | Session 2 Appeared | Overall Unique Appeared | Appearance Rate |
|---|---|---|---|---|---|---|
| 2024 | 12,21,624 | 11,70,048 | 11,79,569 | 10,67,959 | 14,15,110 | 95.8% |
| 2025 | 13,11,544 | 12,58,000 | 10,61,840 | ~10,17,000 | 14,75,103 | 95.9% |
| 2026 (Predicted) | 14,50,000 | 13,90,000 | 11,50,000 | 11,02,000 | 15,50,000 | 96.0% |
Why the JEE Main 2026 Participation is Increasing?
The table outlines key factors driving the expected increase to 15.5 lakh unique appearances, based on expert analyses from coaching institutes and forums.
| Factor | Description | Predicted Impact on 2026 Appearances |
|---|---|---|
| Rising PCM Graduates | More Class 12 Science students (est. 20% YoY increase in eligible pool) | +2-3 lakh |
| Dropper Participation | Around 30% of total are repeaters seeking better scores | +1 lakh |
| Multiple Sessions | Two attempts encourage broader participation | +0.5 lakh |
| Tech Shifts (AI/Data Science) | Popularity of emerging branches boosts engineering aspirations | +0.5-1 lakh |
| Economic/Accessibility Factors | Improved online systems and exam centers (323 cities in 2026) | +0.5 lakh |
How Many Students Appeared and Registered for JEE Main 2025 Session 2?

How Many Students Appeared and Registered for JEE Main 2025 Session 1?
NTA has released the official data for the appeared and registered candidates in the JEE Main Session 1 exam. In the paper 1 B.E./B.Tech the attendance rate of candidates stood at 95.93% while the paper 2 had an attendance of 69.54% for B.Arch and 65.63% for B.Plan. The official data of NTA for registered and appeared candidates in JEE Main Paper 1 and Paper 2 are given below:
JEE Main Session 1 Paper 1 Registered and Appeared Candidates

JEE Main Session 1 Paper 2 Registered and Appeared Candidates

Gender and Category-wise distribution of Registered candidates in the JEE Main Session 1

Gender and Category-wise distribution of Appeared candidates in JEE Main Session 1

Also Check:
Number of JEE Main 2025 Candidates Qualified for JEE Advanced 2025
The exact figure for the number of candidates qualified for JEE Advanced in 2025 is still unknown. However, students can check the expected number of top JEE Main candidates selected to appear for JEE Advanced 2025 in the table below.
|
Category |
Number of JEE Main Candidates Qualified for JEE Advanced 2025 |
|---|---|
|
UR |
97,321 |
|
UR-PwD |
3,950 |
|
EWS |
25,009 |
|
OB |
67,614 |
|
SC |
37,519 |
|
ST |
18,823 |
JEE Main 2025 Statistics
|
Particulars |
Details |
|---|---|
|
Common candidates registered in both sessions |
8,33,536 |
|
Common candidates appeared in both sessions |
7,75,383 |
|
Candidates registered in January 2025 (Session 1) Examination |
13,11,544 |
|
Candidates appeared in January 2025 (Session 1) Examination |
12,58,136 |
|
Candidates registered in April 2025 (Session 2) Examination |
10,61,840 |
|
Candidates appeared in the April 2025 (Session 2) Examination |
9,92,350 |
|
Total unique candidates registered in both Sessions |
15,39,848 |
|
Total unique candidates appeared in both Sessions |
14,75,103 |
How Many Students Appeared and Registered for JEE Main 2024 Session 2?
Out of the total registrations for Session 2, only 21.6% are new registrations. Around 48.3% applied for both January and April sessions, and 29% migrated from January to April.
Category and Gender-wise Students Registered for JEE Main Session 2
|
Category |
General |
EWS |
SC |
ST |
OBC |
Total |
|---|---|---|---|---|---|---|
|
Female |
2,68,418 |
83,492 |
74,793 |
25,918 |
2,73,584 |
7,26,205 |
|
Male |
1,32,278 |
34,090 |
32,083 |
11,766 |
1,25,418 |
3,35,635 |
|
Total |
4,00,696 |
1,17,582 |
1,06,876 |
37,684 |
3,99,002 |
10,61,840 |
Category and Gender-wise Students Appeared for JEE Main Session 2
|
Category |
General |
EWS |
SC |
ST |
OBC |
Total |
|---|---|---|---|---|---|---|
|
Female |
2,50,849 |
80,200 |
68,872 |
23,676 |
2,58,274 |
6,81,871 |
|
Male |
1,21,826 |
32,590 |
29,015 |
10,462 |
1,16,586 |
3,10,479 |
|
Total |
3,72,675 |
1,12,790 |
97,887 |
34,138 |
3,74,860 |
9,92,350 |

JEE Main 2024 Session 2 Shift-wise Registered and Appeared Students
|
Day |
Date of Examination |
Shift |
Registered Candidates |
Appeared Candidates |
Percentage (%) |
|---|---|---|---|---|---|
|
Day 1 |
02 April 2025 |
Shift 1 |
1,17,677 |
1,08,420 |
92.13% |
|
Day 1 |
02 April 2025 |
Shift 2 |
1,17,734 |
1,09,135 |
92.70% |
|
Day 2 |
03 April 2025 |
Shift 1 |
1,17,809 |
1,09,209 |
92.70% |
|
Day 2 |
03 April 2025 |
Shift 2 |
1,17,753 |
1,10,090 |
93.49% |
|
Day 3 |
04 April 2025 |
Shift 1 |
1,17,851 |
1,10,373 |
93.65% |
|
Day 3 |
04 April 2025 |
Shift 2 |
1,18,326 |
1,11,496 |
94.23% |
|
Day 4 |
07 April 2025 |
Shift 1 |
1,18,100 |
1,10,723 |
93.75% |
|
Day 4 |
07 April 2025 |
Shift 2 |
1,18,677 |
1,11,826 |
94.23% |
|
Day 5 |
08 April 2025 |
Shift 2 |
1,17,913 |
1,11,078 |
94.20% |
How Many Students Appeared and Registered for JEE Main 2024 Session 1?
NTA has released JEE Main 2024 registered students' data via press release on February 2, 2024. About 12,31,874 students registered for JEE Main 2024 Session 1. The total registration for JEE Main 2024 Session 1 was about 27% higher than the previous year’s at 12,21,624 candidates. Check the gender, category as well as day-wise number of registered students in JEE Main 2024 below:

JEE Main 2024 Gender Wise Registered Students
| Gender | Female | Male | Third Gender | Total |
|---|---|---|---|---|
| Count of Registered Students | 406920 | 824945 | 9 | 1231874 |
JEE Main 2024 Category Wise Registered Students
| Category | General | EWS | OBC-NCL | SC | ST | Total |
|---|---|---|---|---|---|---|
| Count of Registered Students | 416086 | 154840 | 498179 | 121394 | 41375 | 1231874 |
JEE Main 2024 Paper 2 Registered and Appeared Students
| Day | Date of Examination | Paper | Registered | Appeared | Percentage |
|---|---|---|---|---|---|
| Day 1 | January 24, 2024 | Paper 2 (B.Arch. / B.Planning) | 74002 | 55493 | 75% |
JEE Main 2024 Paper 1 Registered and Appeared Students
| Exam Dates | Shift | Male | Female | Total |
|---|---|---|---|---|
| January 27, 2024 | Shift 1 | 82,371 | 39,816 | 1,22,187 |
| Shift 2 | 85,659 | 39,613 | 1,25,272 | |
| January 29, 2024 | Shift 1 | 82,589 | 39,734 | 1,22,323 |
| Shift 2 | 84,089 | 40,759 | 1,24,848 | |
| January 30, 2024 | Shift 1 | 80,761 | 41,037 | 1,21,798 |
| Shift 2 | 80,936 | 40,092 | 1,21,028 | |
| January 31, 2024 | Shift 1 | 83,389 | 41,705 | 1,25,094 |
| Shift 2 | 81,088 | 39,829 | 1,20,917 | |
| February 01, 2024 | Shift 1 | 81,237 | 39,968 | 1,21,205 |
| Shift 2 | 78,568 | 38,384 | 1,16,952 |
JEE Main Year-Wise Detailed Statistical Analysis
We have also provided detailed year-wise JEE Main registration statistics here to help you analyze the increasing competition level for this exam. You can compare the total registrations and unique registrations for each year below.
JEE Main 2023 Statistics
The National Testing Agency has released an official notification that says a total of 11,13,325 students appeared for both sessions of the JEE Main 2023 exam. The Number of candidates registered and appeared for JEE (Main)-2023 B.E./B.Tech (Paper 1) in both Sessions:-
| Particulars | Details |
|---|---|
| Common candidates Registered in both sessions | 629,000 |
| Common candidates Appeared in both sessions | 594,013 |
| Candidates registered in January 2023 (Session 1) Examination | 860,064 |
| Candidates appeared in January 2023 (Session 1) Examination | 823,967 |
| Candidates registered in April 2023 (Session 2) Examination | 931,334 |
| Candidates appeared in April 2023 (Session 2) Examination | 883,367 |
| Total unique candidates Registered in both Sessions | 1,162,398 |
| Total unique candidates Appeared in both Sessions | 1,113,325 |
JEE Main 2023 Gender Wise Registration Analysis
Gender/Category wise distribution of candidates Registered in both Sessions:-
| Gender | General | Gen-EWS | OBC- NCL | SC | ST | PwD | Total |
|---|---|---|---|---|---|---|---|
| Female | 139417 | 35397 | 136172 | 33198 | 12709 | 652 | 357545 |
| Male | 303169 | 86919 | 303919 | 80254 | 28050 | 2537 | 804848 |
| Third Gender | 2 | 1 | 2 | 0 | 0 | 0 | 5 |
| Total | 442588 | 122317 | 440093 | 113452 | 40759 | 3189 | 1162398 |
JEE Main 2023 Gender Wise Appeared Students
Gender/Category wise distribution of candidates Appeared in both Sessions:-
| Gender | General | Gen-EWS | OBC- NCL | SC | ST | PwD | Total |
|---|---|---|---|---|---|---|---|
| Female | 132176 | 34798 | 129190 | 30677 | 11503 | 619 | 338963 |
| Male | 290936 | 85696 | 293488 | 75658 | 26154 | 2427 | 774359 |
| Third Gender | 0 | 1 | 2 | 0 | 0 | 0 | 3 |
| Total | 423112 | 120495 | 422680 | 106335 | 37657 | 3046 | 1113325 |
JEE Main 2022 Statistics
As per the official notification by NTA, a total of 1,026,799 students appeared for the JEE Main 2022 in both sessions. Refer to the table below for comprehensive details regarding the number of aspirants who participated in the JEE Main exam.
| Particulars | Details |
|---|---|
| Common candidates Registered in both sessions | 468,205 |
| Common candidates Appeared in both sessions | 404,256 |
| Candidates registered in June 2022 (Session 1) Examination | 872,970 |
| Candidates appeared in June 2022 (Session 1) Examination | 769,604 |
| Candidates registered in July 2022 (Session 2) Examination | 622,034 |
| Candidates appeared in July 2022 (Session 2) Examination | 540,242 |
| Total unique candidates Registered in both Sessions | 1,026,799 |
| Total unique candidates Appeared in both Sessions | 905,590 |
JEE Main 2022 Gender Wise Registration Analysis
| GENDER GENERAL GEN- | General | EWS | OBC- | SC | ST | PWD | Total |
|---|---|---|---|---|---|---|---|
| Male | 302486 | 63372 | 261837 | 72825 | 26858 | 2259 | 727378 |
| Female | 128746 | 24712 | 107837 | 27260 | 10862 | 545 | 299417 |
| Third Gender | 1 | 1 | 2 | - | - | - | 4 |
| Total | 431233 | 88085 | 369676 | 100085 | 37720 | 2804 | 1026799 |
JEE Main 2022 Gender Wise Appeared Students
| GENDER GENERAL GEN- | General | EWS | OBC- | SC | ST | PWD | Total |
|---|---|---|---|---|---|---|---|
| Male | 267982 | 60052 | 234798 | 63125 | 22598 | 2009 | 648555 |
| Female | 110224 | 22990 | 92411 | 22813 | 8593 | 471 | 257031 |
| Third Gender | 1 | 1 | 2 | - | - | - | 4 |
| Total | 378207 | 83043 | 327211 | 85938 | 31191 | 2480 | 905590 |
What is the Importance of Knowing JEE Main Previous Year Analysis?
For instance, let’s assume a student is curious to know how difficult is JEE Main entrance examination or how previous years’ examinees scored. Previous year analysis helps us understand the number of individuals who took the JEE Main exam and helps us estimate a candidate's current standing and areas for improvement. We also get a rough insight of JEE Main selection from the previous years’ trends of registration and analysis.
Frequently Asked Questions
Ques. What was the total number of candidates who appeared for JEE Main in 2023, and how does it compare to previous years?
Ans. As per the National Testing Agency (NTA), a significant total of 11,13,325 candidates appeared for both sessions of JEE Main in 2023. This figure indicates a consistent trend of substantial participation in recent years, showcasing a continuous interest and engagement among aspirants in the JEE Main exams.
Ques. Can you provide insights into the number of candidates appearing for JEE Main in different sessions over the past few years?
Ans. The statistics reveal varying participation across different sessions of JEE Main exams. For instance, in 2023, the January session witnessed approximately 8.2 lakh candidates out of 8.6 lakh registered, whereas the April session saw 8.8 lakh out of 9.3 lakh candidates taking the test. This fluctuation in attendance among sessions has been consistent in previous years too.
Ques. How many candidates typically register and appear for JEE Main exams annually?
Ans. Over the years, the number of candidates registering and appearing for JEE Main has showcased a substantial magnitude. For instance, in 2022, around 1,026,799 candidates appeared in both sessions. This number, varying from year to year, demonstrates the continuous popularity and significance of the JEE Main examination.
Ques. What was the percentage of students appearing for the JEE Main 2023 January session, and how does it compare to the April session?
Ans. In the January session of JEE Main 2023, the percentage of candidates who appeared stood at an impressive 95.79% out of those registered. Comparatively, for the April session, the participation rate was equally substantial, maintaining the consistent trend of high attendance in both sessions.
Ques. Are there variations in the number of candidates registering and appearing in different months of the year for JEE Main exams?
Ans. Yes, there are observable fluctuations in registration and appearance numbers across different months. For example, in 2021, the February session witnessed 652,628 registrations, whereas the March session had 619,641 registrations. Such variations in registration numbers across different sessions depict the dynamic nature of candidate engagement with the examination.


Comments